Data in Healthcare / Alzheimer's data visualization
Data in Healthcare / Alzheimer's data visualization
Usability Testing /
Amon Carter Museum of Art
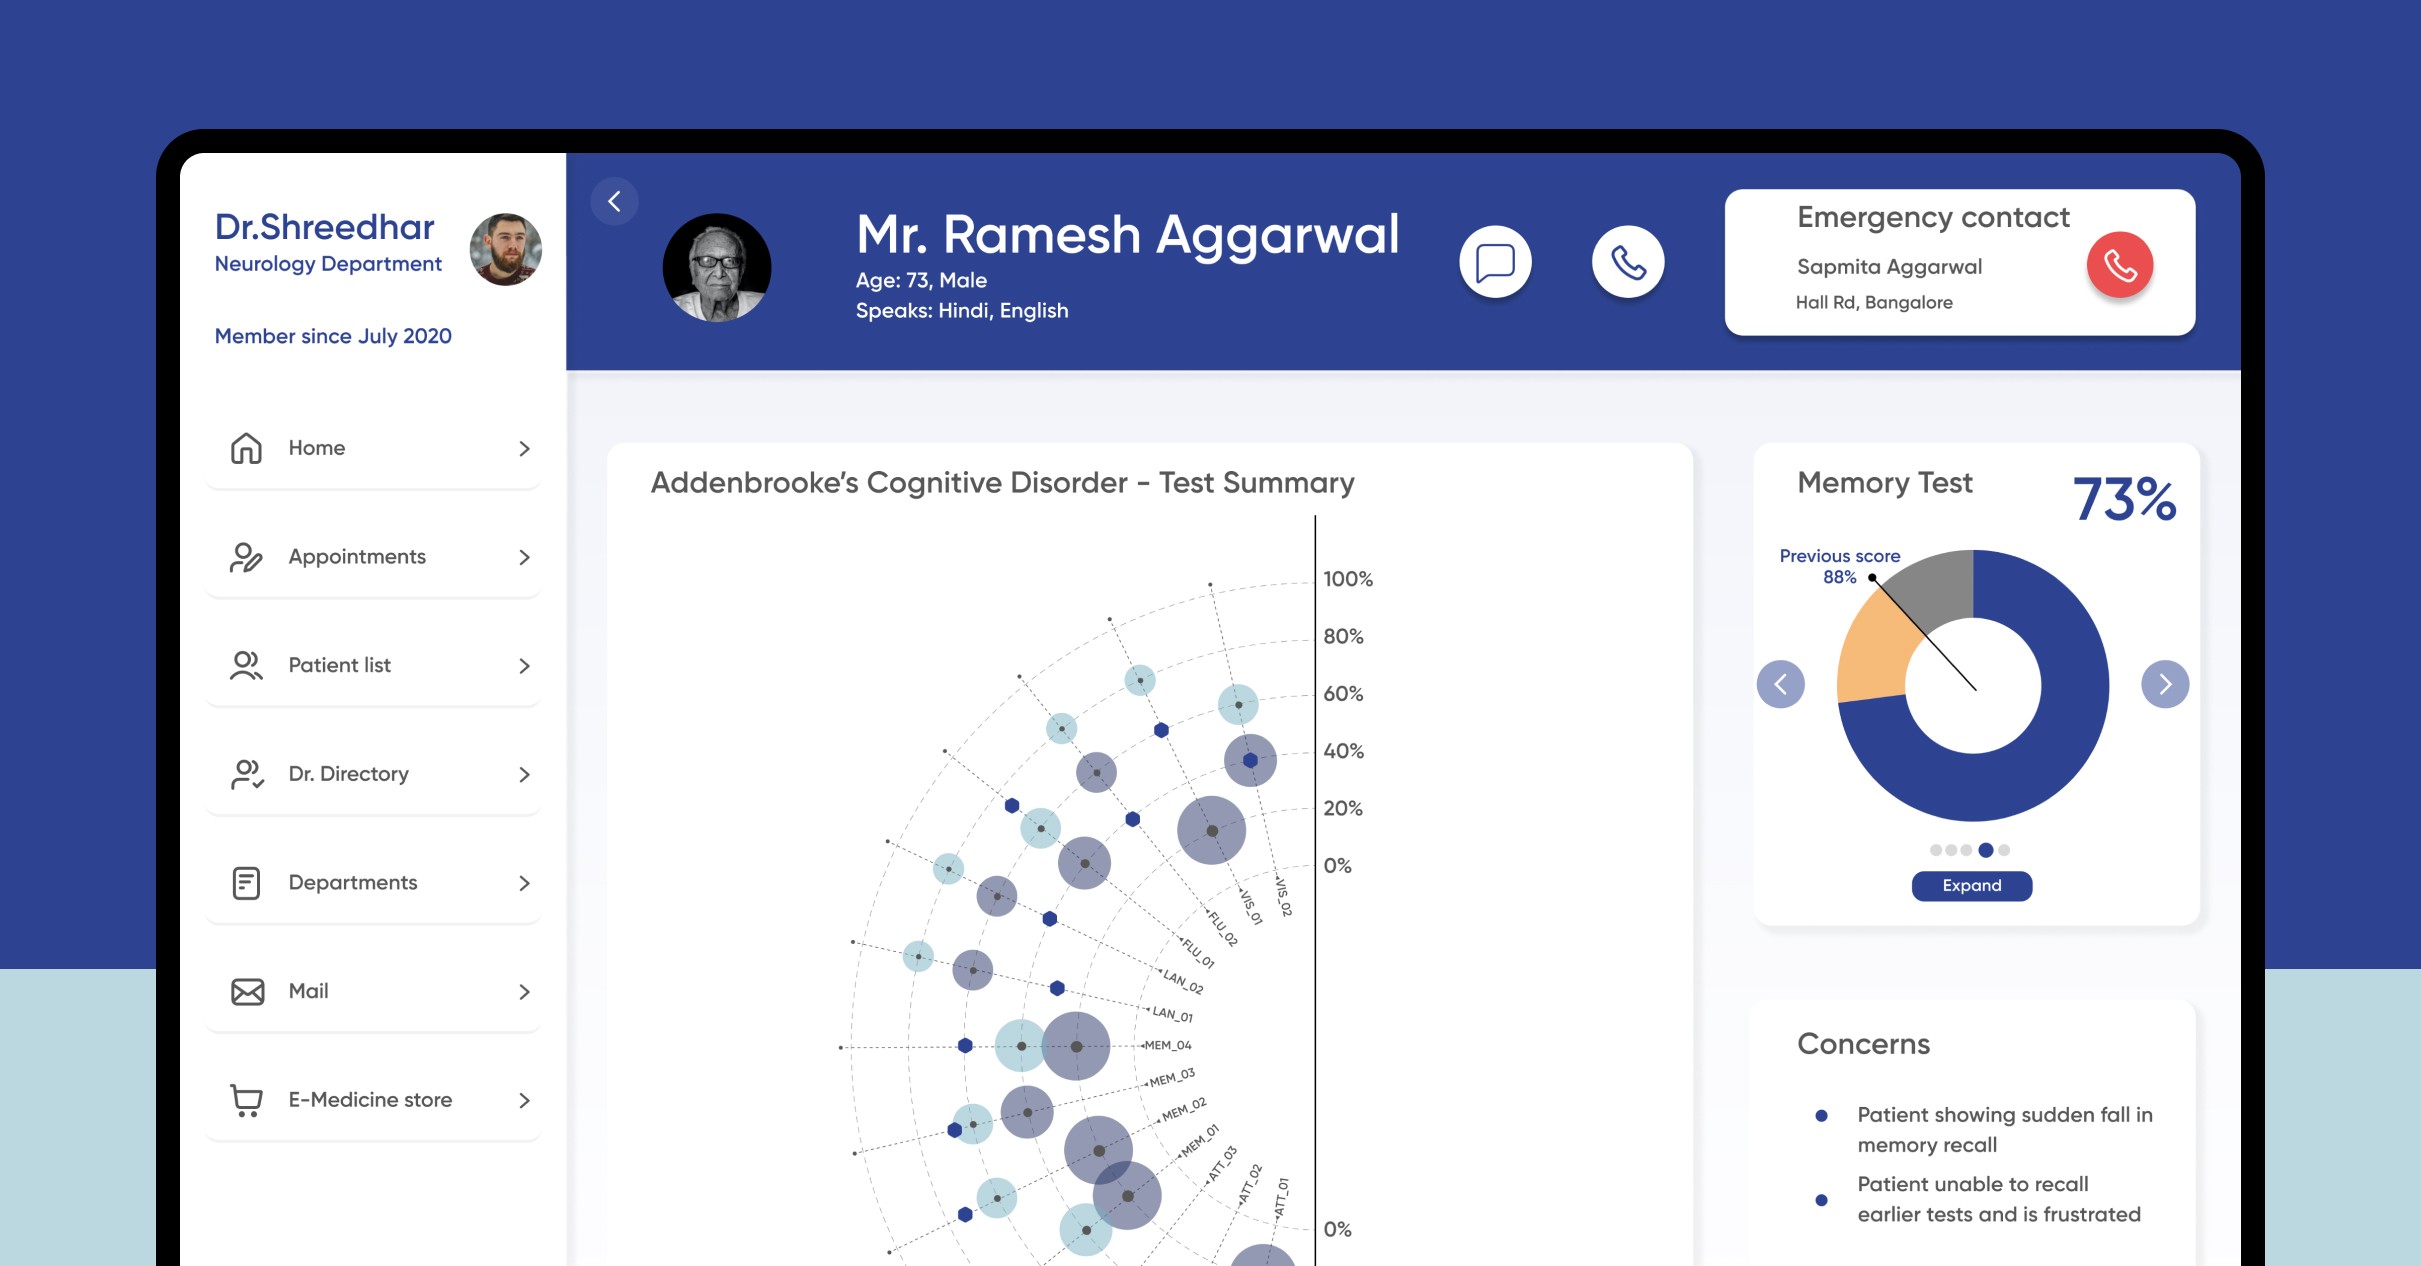
This project represents my initial, self-initiated journey into the world of UX, undertaken before gaining any formal industry experience or attending graduate school. Driven by both passion and the necessity for thoughtful design in sensitive contexts, I conducted user research to develop a dashboard that reimagines the relationship between doctors and caregivers. As my first project using Figma, I self-taught the software while creating this design.
This project represents my initial, self-initiated journey into the world of UX, undertaken before gaining any formal industry experience or attending graduate school. Driven by both passion and the necessity for thoughtful design in sensitive contexts, I conducted user research to develop a dashboard that reimagines the relationship between doctors and caregivers. As my first project using Figma, I self-taught the software while creating this design.
This project represents my initial, self-initiated journey into the world of UX, undertaken before gaining any formal industry experience or attending graduate school. Driven by both passion and the necessity for thoughtful design in sensitive contexts, I conducted user research to develop a dashboard that reimagines the relationship between doctors and caregivers. As my first project using Figma, I self-taught the software while creating this design.


Why this project matters to me :)
Why this project matters to me :)
Why this project matters to me :)
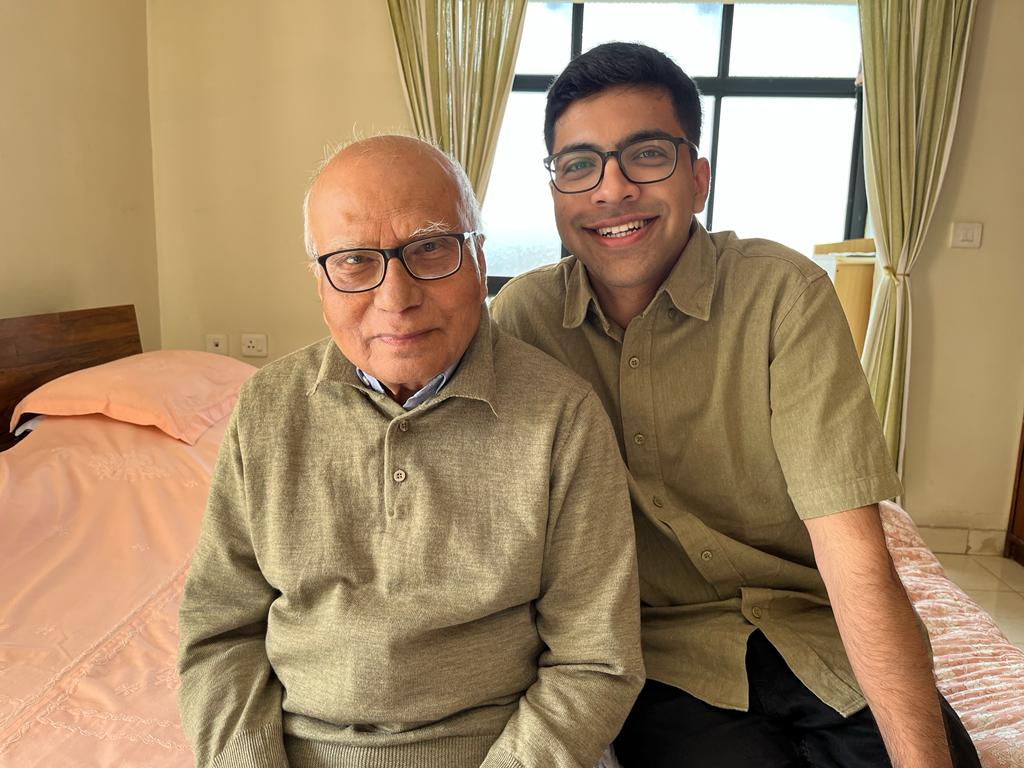
This subject is deeply personal as my grandfather has been battling Alzheimer's for over eight years. As one of his many caregivers, I've faced challenges in specialized caregiving and navigating interactions with doctors. Recognizing a lack of trust between caregivers and doctors due to the ambiguous data shared, I set out to design an improved communication channel between caregivers and doctors.
This subject is deeply personal as my grandfather has been battling Alzheimer's for over eight years. As one of his many caregivers, I've faced challenges in specialized caregiving and navigating interactions with doctors. Recognizing a lack of trust between caregivers and doctors due to the ambiguous data shared, I set out to design an improved communication channel between caregivers and doctors.
This subject is deeply personal as my grandfather has been battling Alzheimer's for over eight years. As one of his many caregivers, I've faced challenges in specialized caregiving and navigating interactions with doctors. Recognizing a lack of trust between caregivers and doctors due to the ambiguous data shared, I set out to design an improved communication channel between caregivers and doctors.


What did I do?
What did I do?
What did I do?
I collaborated with Dr. Siddharth Ramanan, Post-Doc at Cambridge University in my research phase to better understand why the gap in communication exists, and then proposed a dashboard that aims to address those issues.
I collaborated with Dr. Siddharth Ramanan, Post-Doc at Cambridge University in my research phase to better understand why the gap in communication exists, and then proposed a dashboard that aims to address those issues.
I collaborated with Dr. Siddharth Ramanan, Post-Doc at Cambridge University in my research phase to better understand why the gap in communication exists, and then proposed a dashboard that aims to address those issues.


Introduction
Introduction
What is Alzheimer's disease?
What is Alzheimer's disease?
What is Alzheimer's disease?
Alzheimer's disease (AD) is a neurodegenerative disease that usually starts slowly and progressively worsens, and is the cause of 60-70% of cases of dementia. The most common early symptom is difficulty in remembering recent events. As of 2020, there were approximately 50 million people worldwide with Alzheimer's disease.
Alzheimer's disease (AD) is a neurodegenerative disease that usually starts slowly and progressively worsens, and is the cause of 60-70% of cases of dementia. The most common early symptom is difficulty in remembering recent events. As of 2020, there were approximately 50 million people worldwide with Alzheimer's disease.
Alzheimer's disease (AD) is a neurodegenerative disease that usually starts slowly and progressively worsens, and is the cause of 60-70% of cases of dementia. The most common early symptom is difficulty in remembering recent events. As of 2020, there were approximately 50 million people worldwide with Alzheimer's disease.
What makes designing for this use case unique?
What makes designing for this use case unique?
End-user is not the actual patient
End-user is not the actual patient
End-user is not the actual patient
Patients contribute a substantial amount of data, yet autonomy in interactions with doctors and medical professionals, resides with their caregivers.
Patients contribute a substantial amount of data, yet autonomy in interactions with doctors and medical professionals, resides with their caregivers.
Patients contribute a substantial amount of data, yet autonomy in interactions with doctors and medical professionals, resides with their caregivers.
Medical data is difficult to understand
Medical data is difficult to understand
Medical data is difficult to understand
Data can be complex, overwhelming and confusing for people without medical expertise
Data can be complex, overwhelming and confusing for people without medical expertise
Data can be complex, overwhelming and confusing for people without medical expertise
Difficult to predict trends/progress
Difficult to predict trends/progress
Difficult to predict trends/progress
As of today, there are no accurate methods to predict progress of Alzheimer's disease as it varies (significantly) from patient to patient.
As of today, there are no accurate methods to predict progress of Alzheimer's disease as it varies (significantly) from patient to patient.
As of today, there are no accurate methods to predict progress of Alzheimer's disease as it varies (significantly) from patient to patient.


Exploratory Research: Stage I
Exploratory Research: Stage I
Finding out what challenges users were facing
Finding out what challenges users were facing
Finding out what challenges users were facing
To address the study's dual focus on both doctors and caregivers, I conducted informal interviews with both groups. The goal was to gain a deeper understanding of their experiences with the disease as well as their interactions with each other.
To address the study's dual focus on both doctors and caregivers, I conducted informal interviews with both groups. The goal was to gain a deeper understanding of their experiences with the disease as well as their interactions with each other.
To address the study's dual focus on both doctors and caregivers, I conducted informal interviews with both groups. The goal was to gain a deeper understanding of their experiences with the disease as well as their interactions with each other.
01
01
01
Dealing with the complexity and sensitivity of the data
Dealing with the complexity and sensitivity of the data
Dealing with the complexity and sensitivity of the data
Caregivers needed a simpler and less distressing format to process the information shared
Caregivers needed a simpler and less distressing format to process the information shared
Caregivers needed a simpler and less distressing format to process the information shared
02
02
02
Patients typically have a lot of medical data on file, time consuming to scan
Patients typically have a lot of medical data on file, time consuming to scan
Patients typically have extensive medical data on file, difficult to scan
For doctors, the priority is to present information in a way that can be scanned through quickly
For doctors, the priority is to present information in a way that can be scanned through quickly
For doctors, the priority is to present information in a way that can be scanned through quickly
03
03
03
Information shared to caregivers was not always relevant / actionable
Information shared to caregivers was not always relevant / actionable
Information shared to caregivers was not always relevant / actionable
Mismatch in information shared to caregivers, leading to confusion and distrust
Mismatch in information shared to caregivers, leading to confusion and distrust
Mismatch in information shared to caregivers, leading to confusion and distrust
Exploratory Research: Stage II
Exploratory Research: Stage II
Identifying what data is available and shared between the two user groups
Identifying what data is available and shared between the two user groups
Identifying what data is available and shared between the two user groups
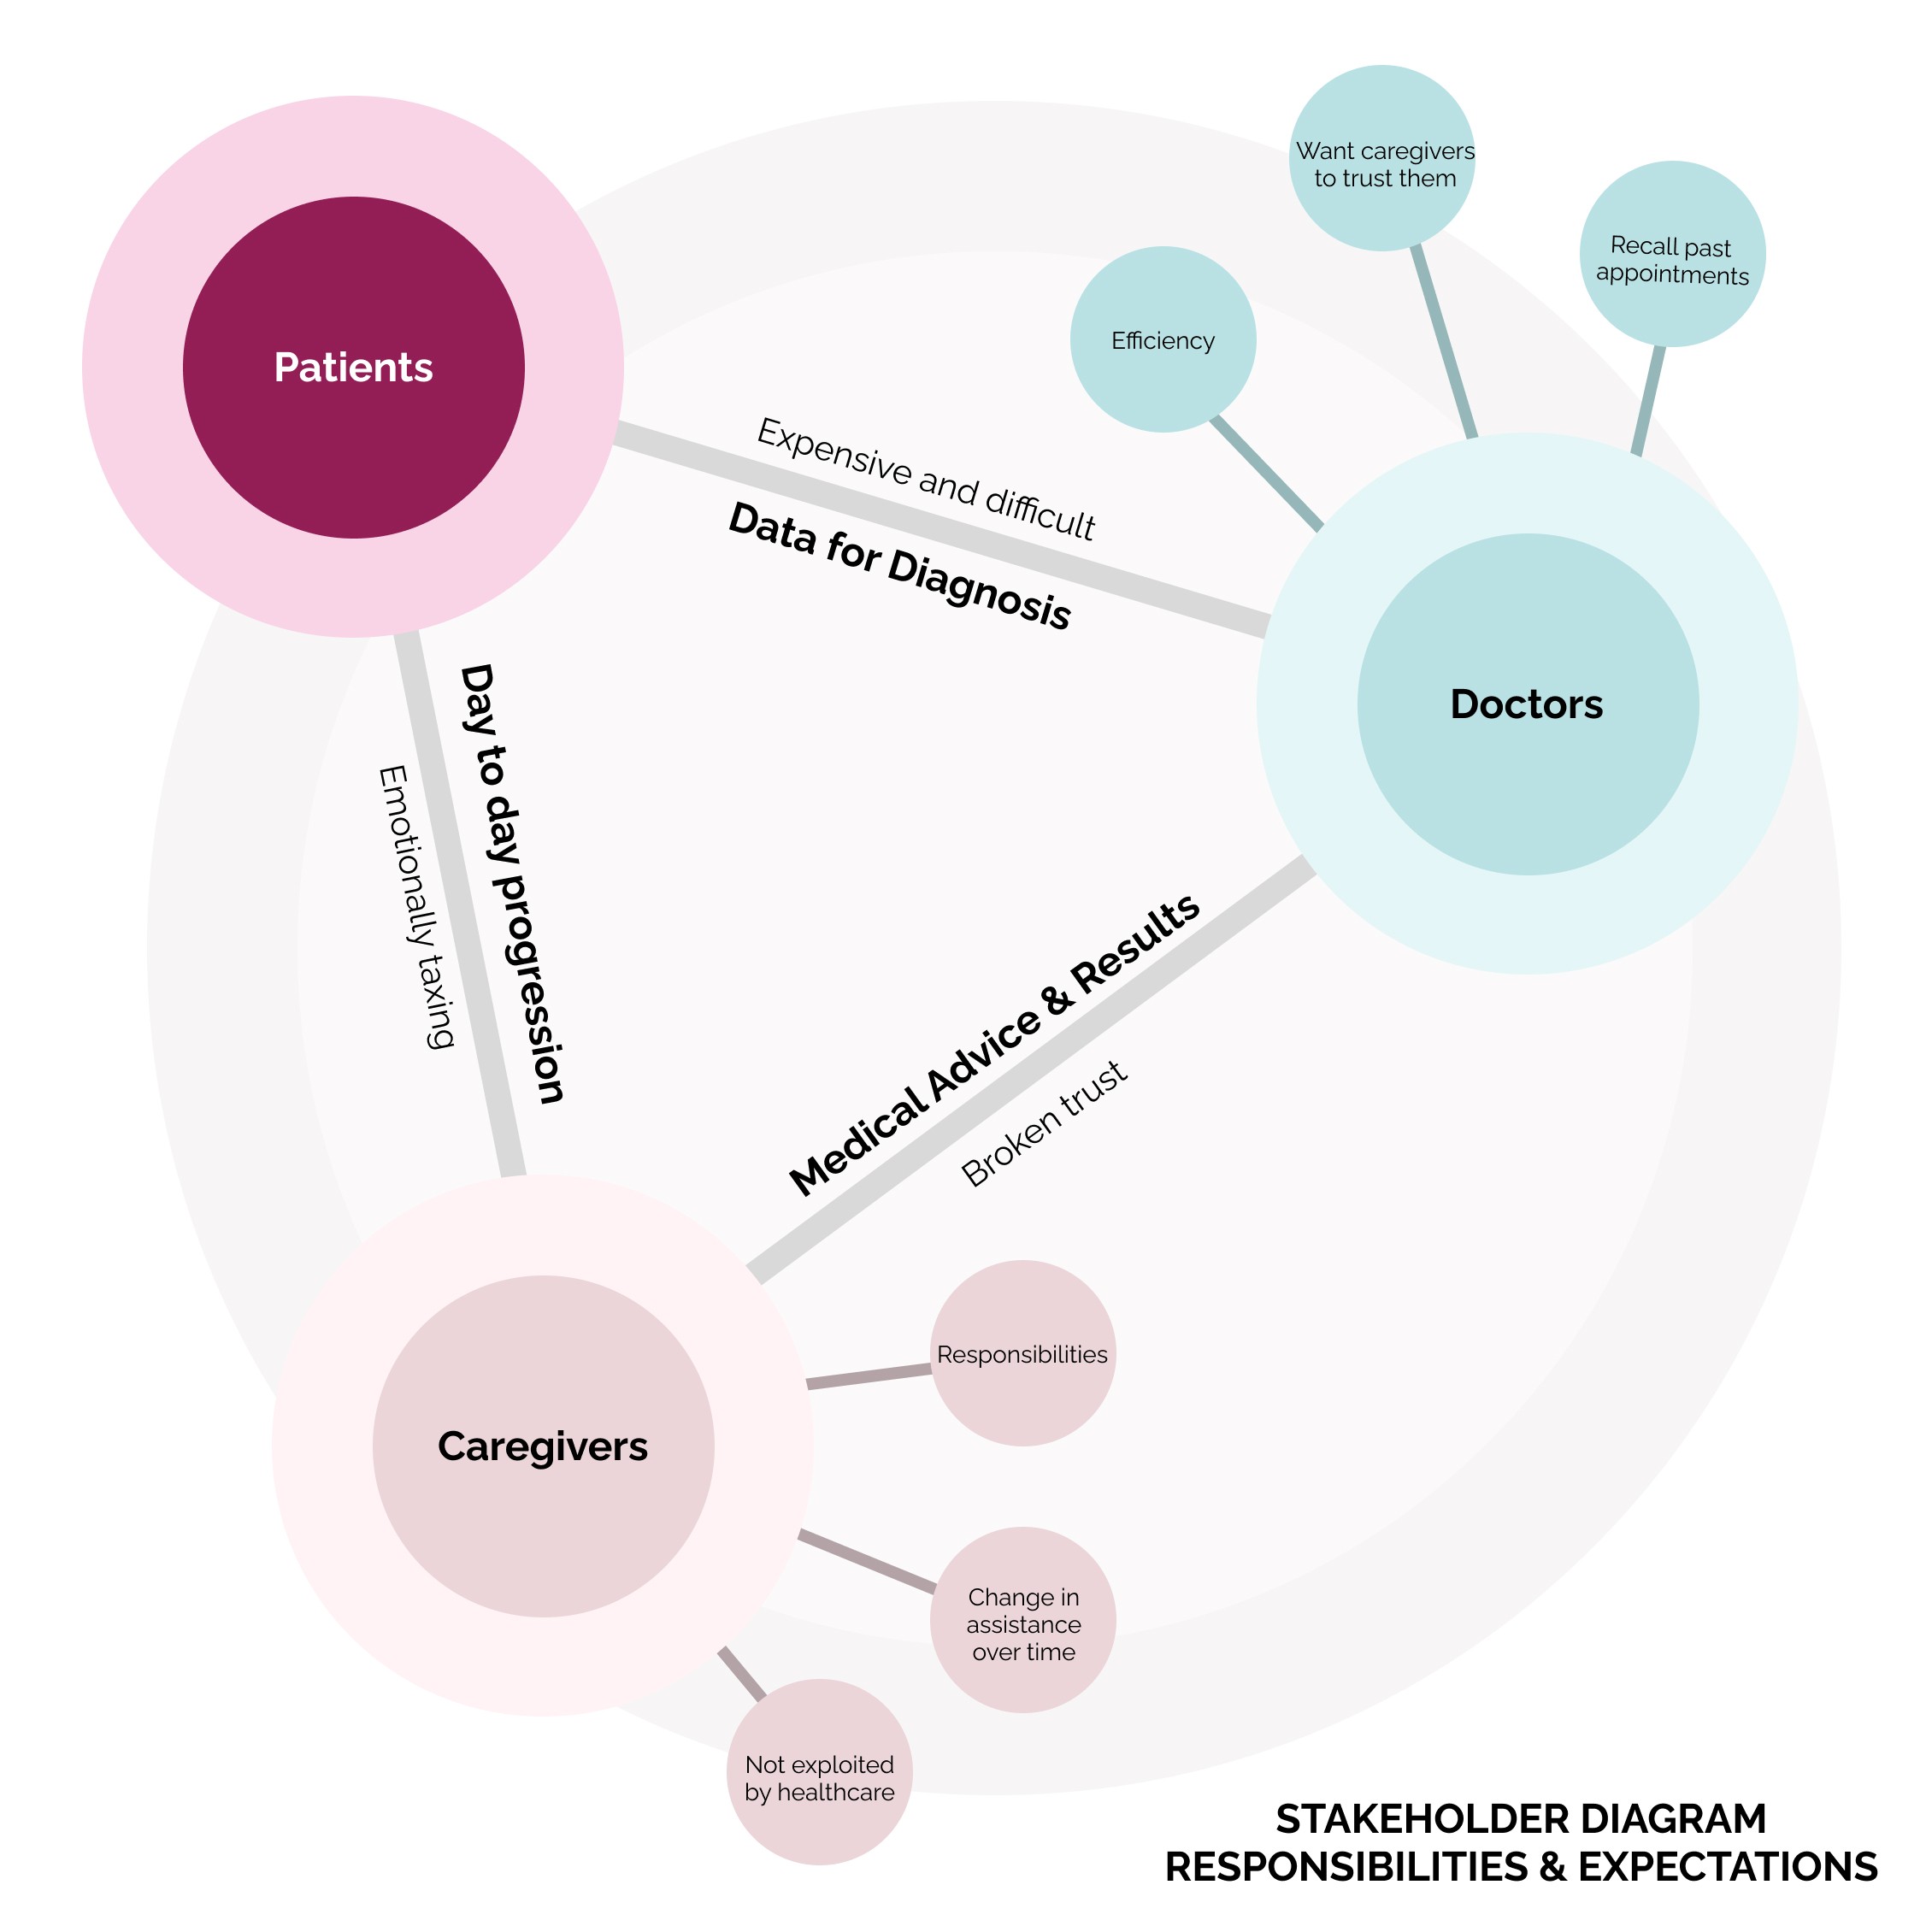
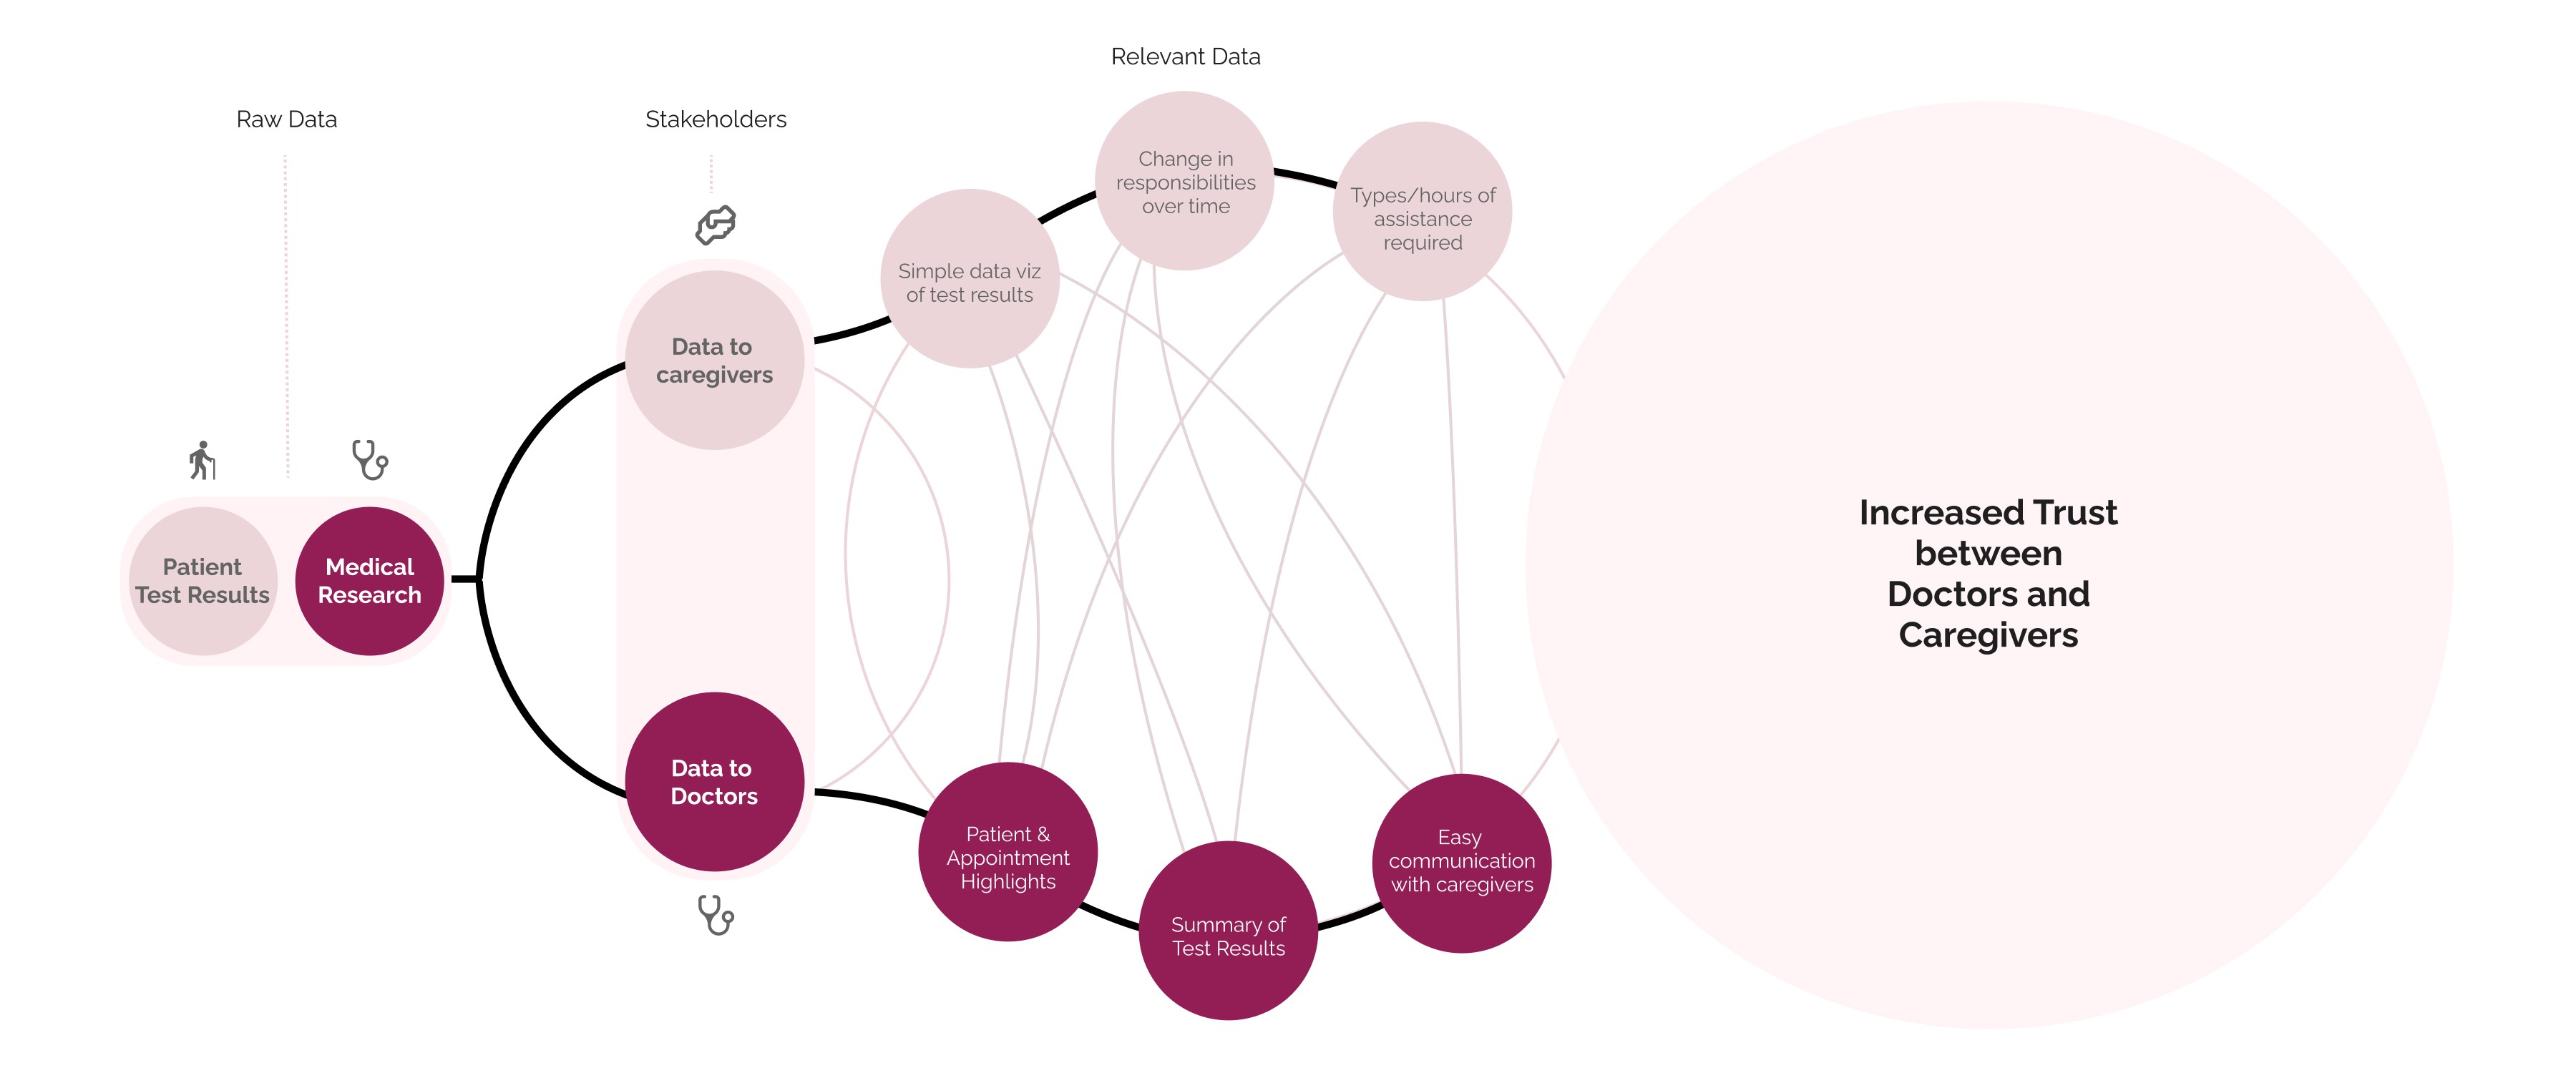
The informal interviews highlighted a mismatch in the information shared between the two user groups and its relevance. At this stage, I aimed to understand what data is generated and what is required by each user group, as well as the information flow between them. This analysis helped identify the main problems of concern and any potential design requirements.
The informal interviews highlighted a mismatch in the information shared between the two user groups and its relevance. At this stage, I aimed to understand what data is generated and what is required by each user group, as well as the information flow between them. This analysis helped identify the main problems of concern and any potential design requirements.
The informal interviews highlighted a mismatch in the information shared between the two user groups and its relevance. At this stage, I aimed to understand what data is generated and what is required by each user group, as well as the information flow between them. This analysis helped identify the main problems of concern and any potential design requirements.


Exploratory Research: Stage III
Exploring the suitability of ACE to bridge the communication gap
Exploring the suitability of ACE to bridge the communication gap
Exploring the suitability of ACE to bridge the communication gap
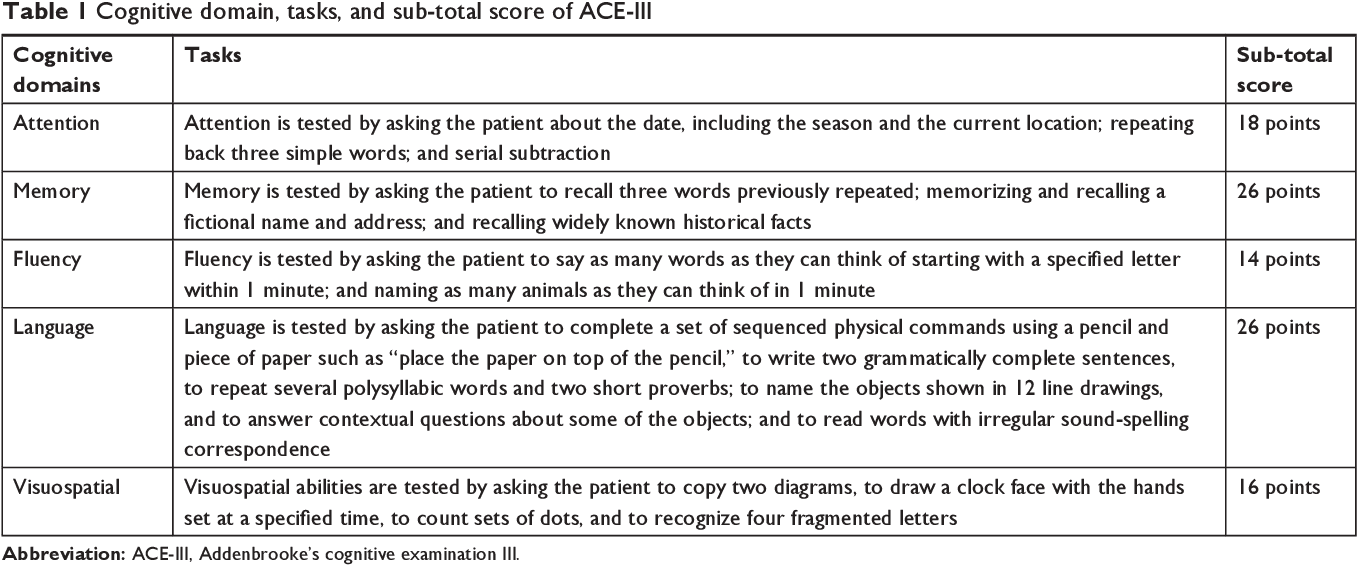
Interviews highlighted that caregivers often distrusted the information shared by doctors due to its qualitative nature. To address this issue, doctors typically ask caregivers to use the Addenbrooke's Cognitive Examination (ACE). The ACE is a neuropsychological test used to identify cognitive impairments, which caregivers can conduct themselves. This approach helps build trust and provides quantifiable data that is easier to understand and track.
The ACE consists of 19 activities that test five cognitive domains: Attention, Memory, Fluency, Language, and Visuospatial Processing.
What makes it suitable for this use case?
What makes it suitable for this use case?
Generates quantifiable data, easier to understand and track progress
Can be conducted by caregivers independently and at their own convenience
Less stressful for patients


My Design Process
My Design Process
My Design Process
To ensure the relevance to the end users, I incorporated user testing throughout the design process. User insights helped me cut down the content shown to either user group by focusing only only on relevant content and key interactions for both doctors and caregivers.
To ensure the relevance to the end users, I incorporated user testing throughout the design process. User insights helped me cut down the content shown to either user group by focusing only only on relevant content and key interactions for both doctors and caregivers.
To ensure the relevance to the end users, I incorporated user testing throughout the design process. User insights helped me cut down the content shown to either user group by focusing only only on relevant content and key interactions for both doctors and caregivers.

Sketching + Relevant data division
Sketching + Relevant data division
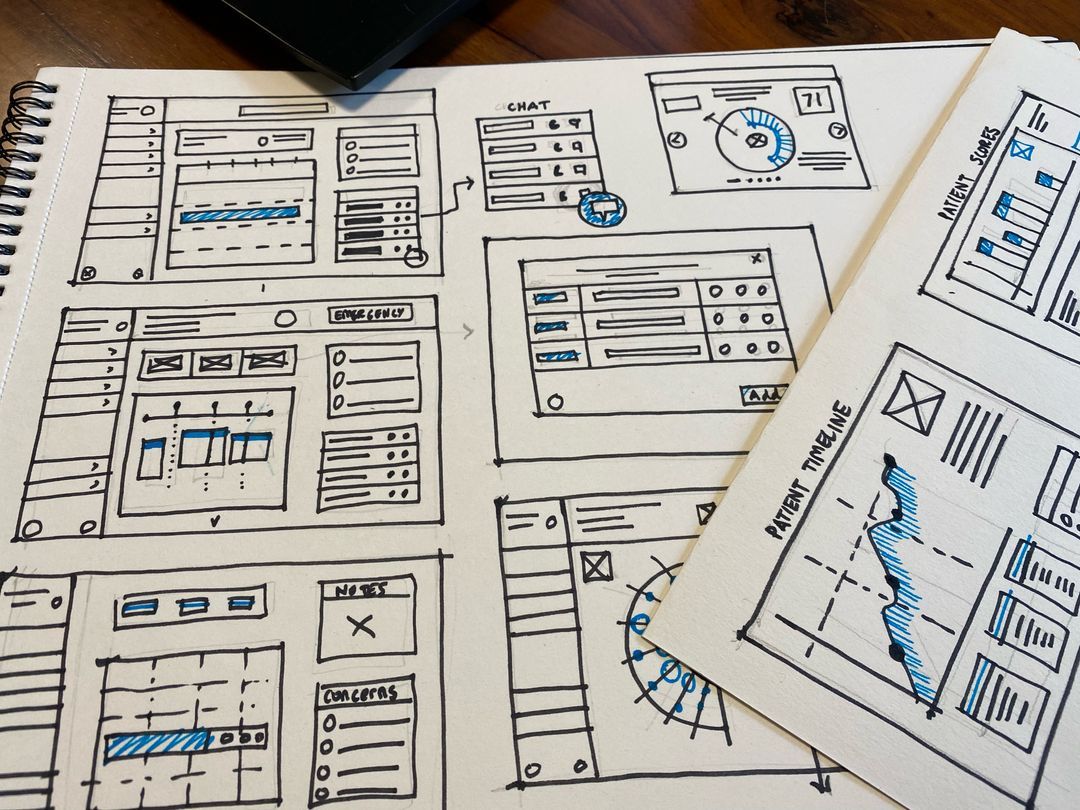
I first decided to sketch out options for the different screens for doctors and caregivers separately.
I first decided to sketch out options for the different screens for doctors and caregivers separately.

Wireframing and prototype testing
Wireframing and prototype testing
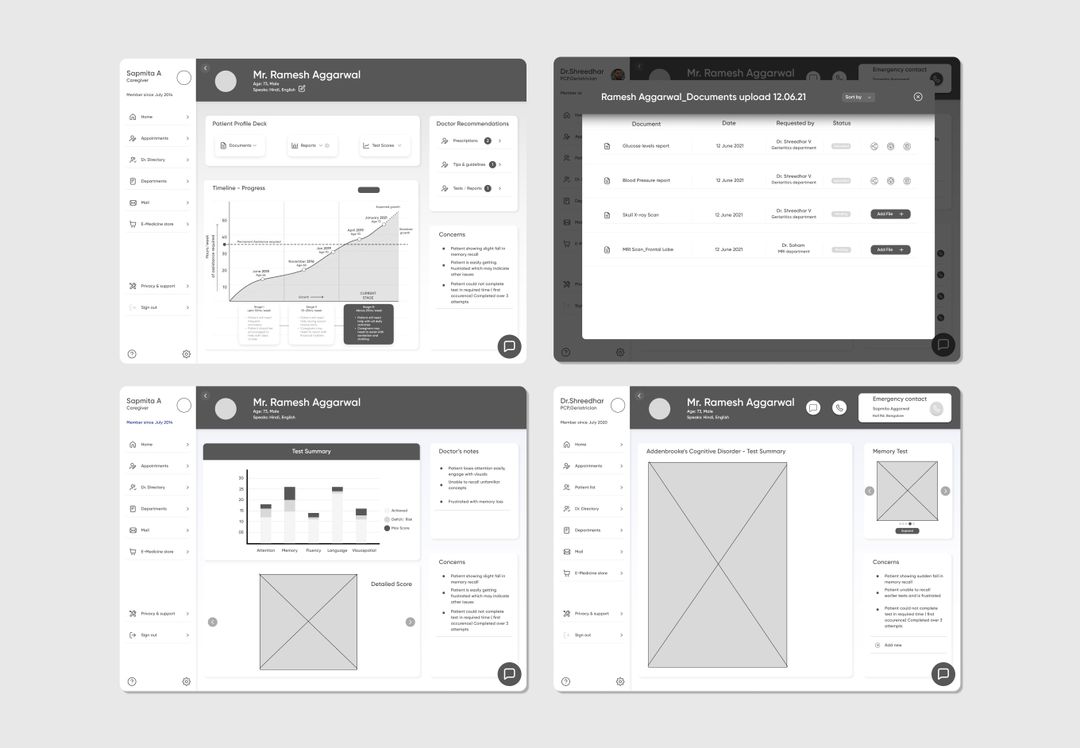
I then proceeded to make wireframes and test it with users by making lo-fi prototypes on Figma.
I then proceeded to make wireframes and test it with users by making lo-fi prototypes on Figma.

Style guide + Hi-fi prototyping
Style guide + Hi-fi prototyping
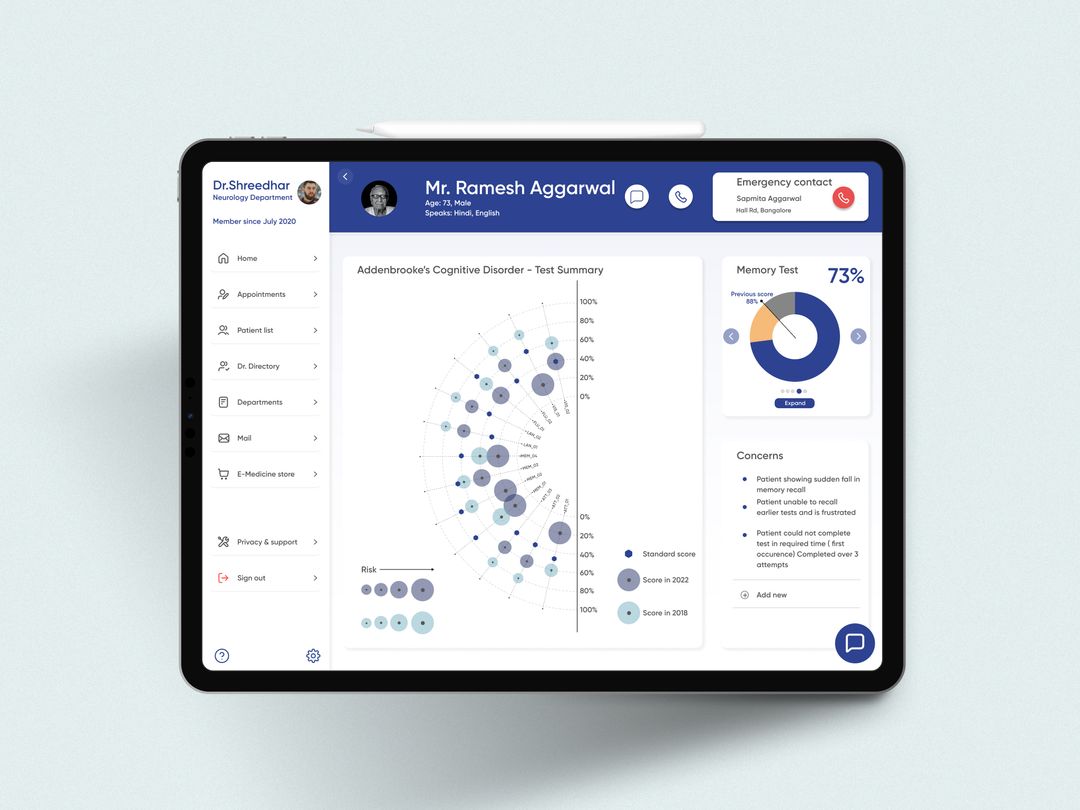
Using an visual style of cool and calming tones, I then made interactive high fidelity prototypes and tested it with users.
Design Screens for Doctors
Design Screens for Doctors
Design Screens for Doctors
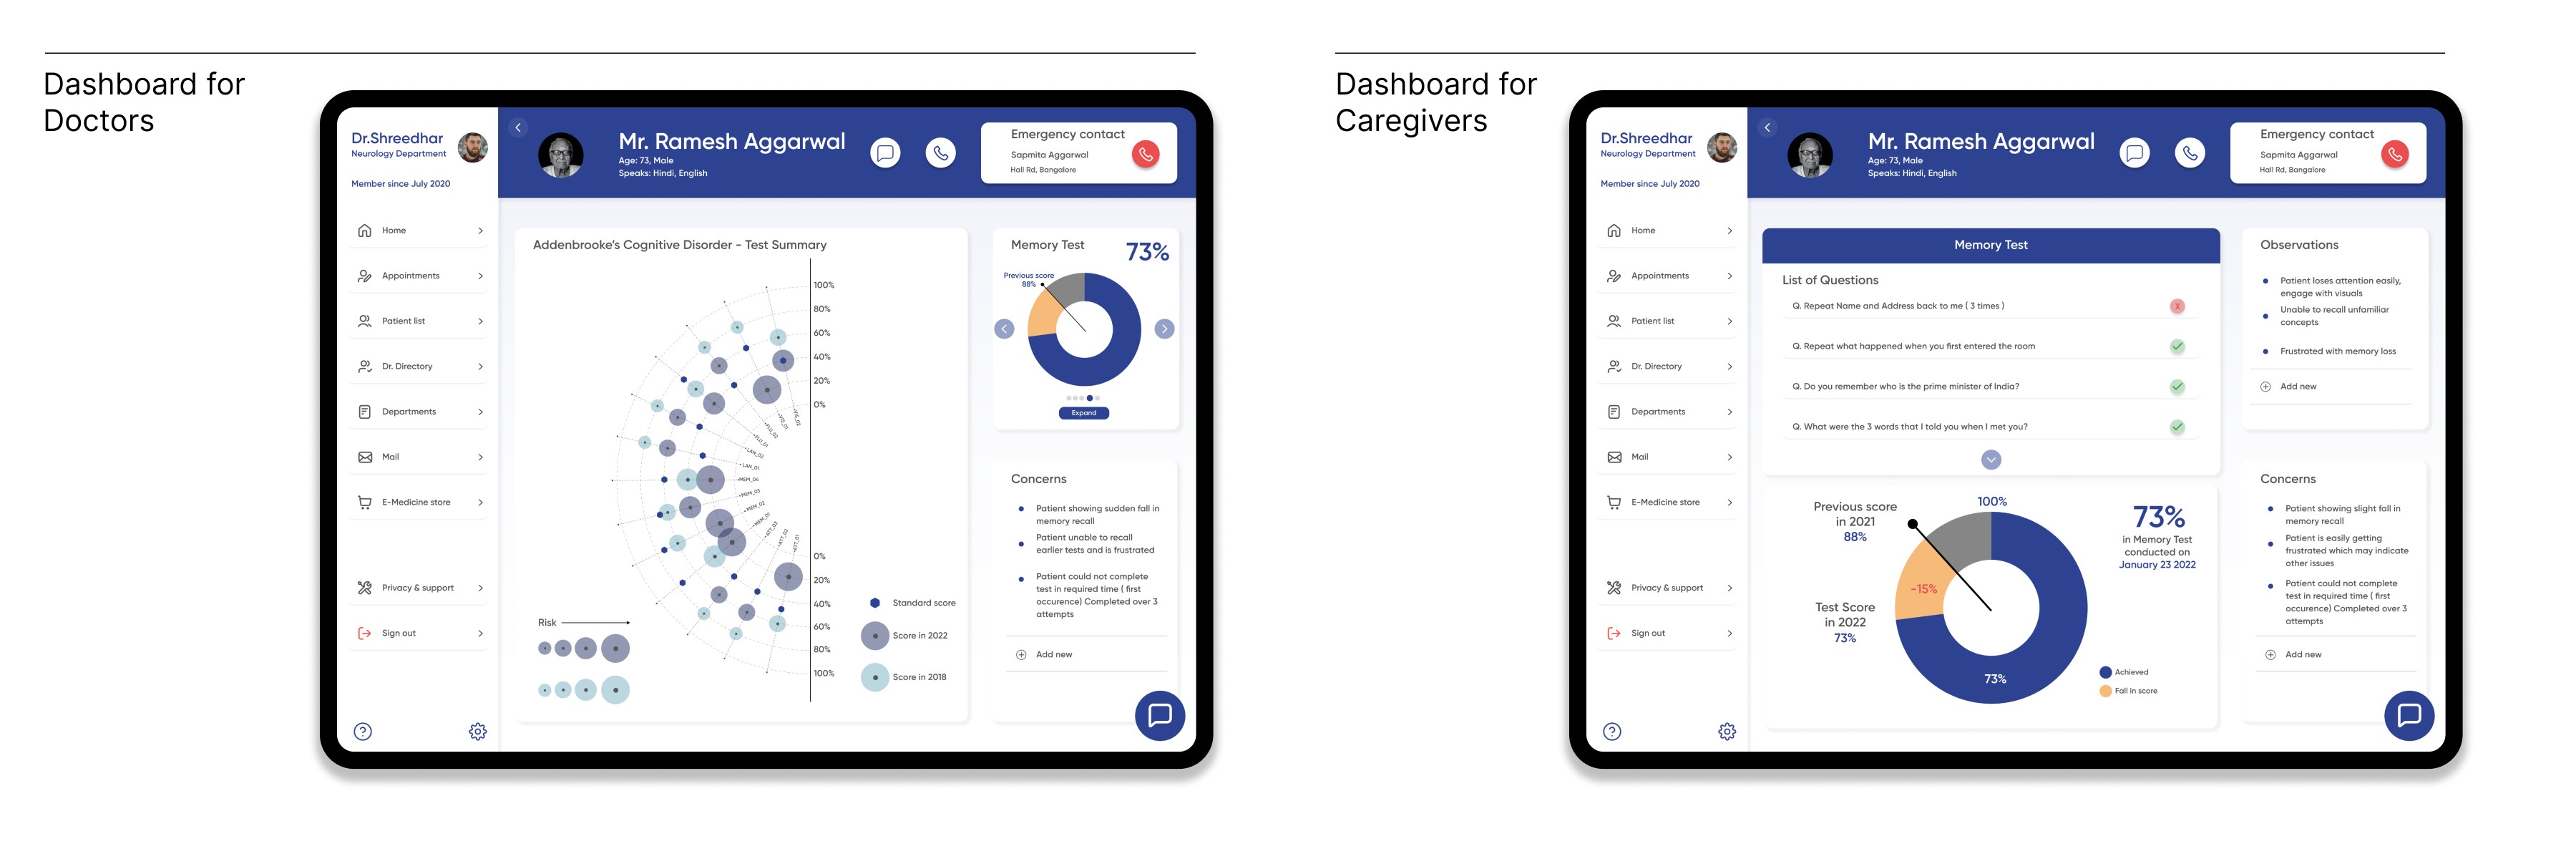
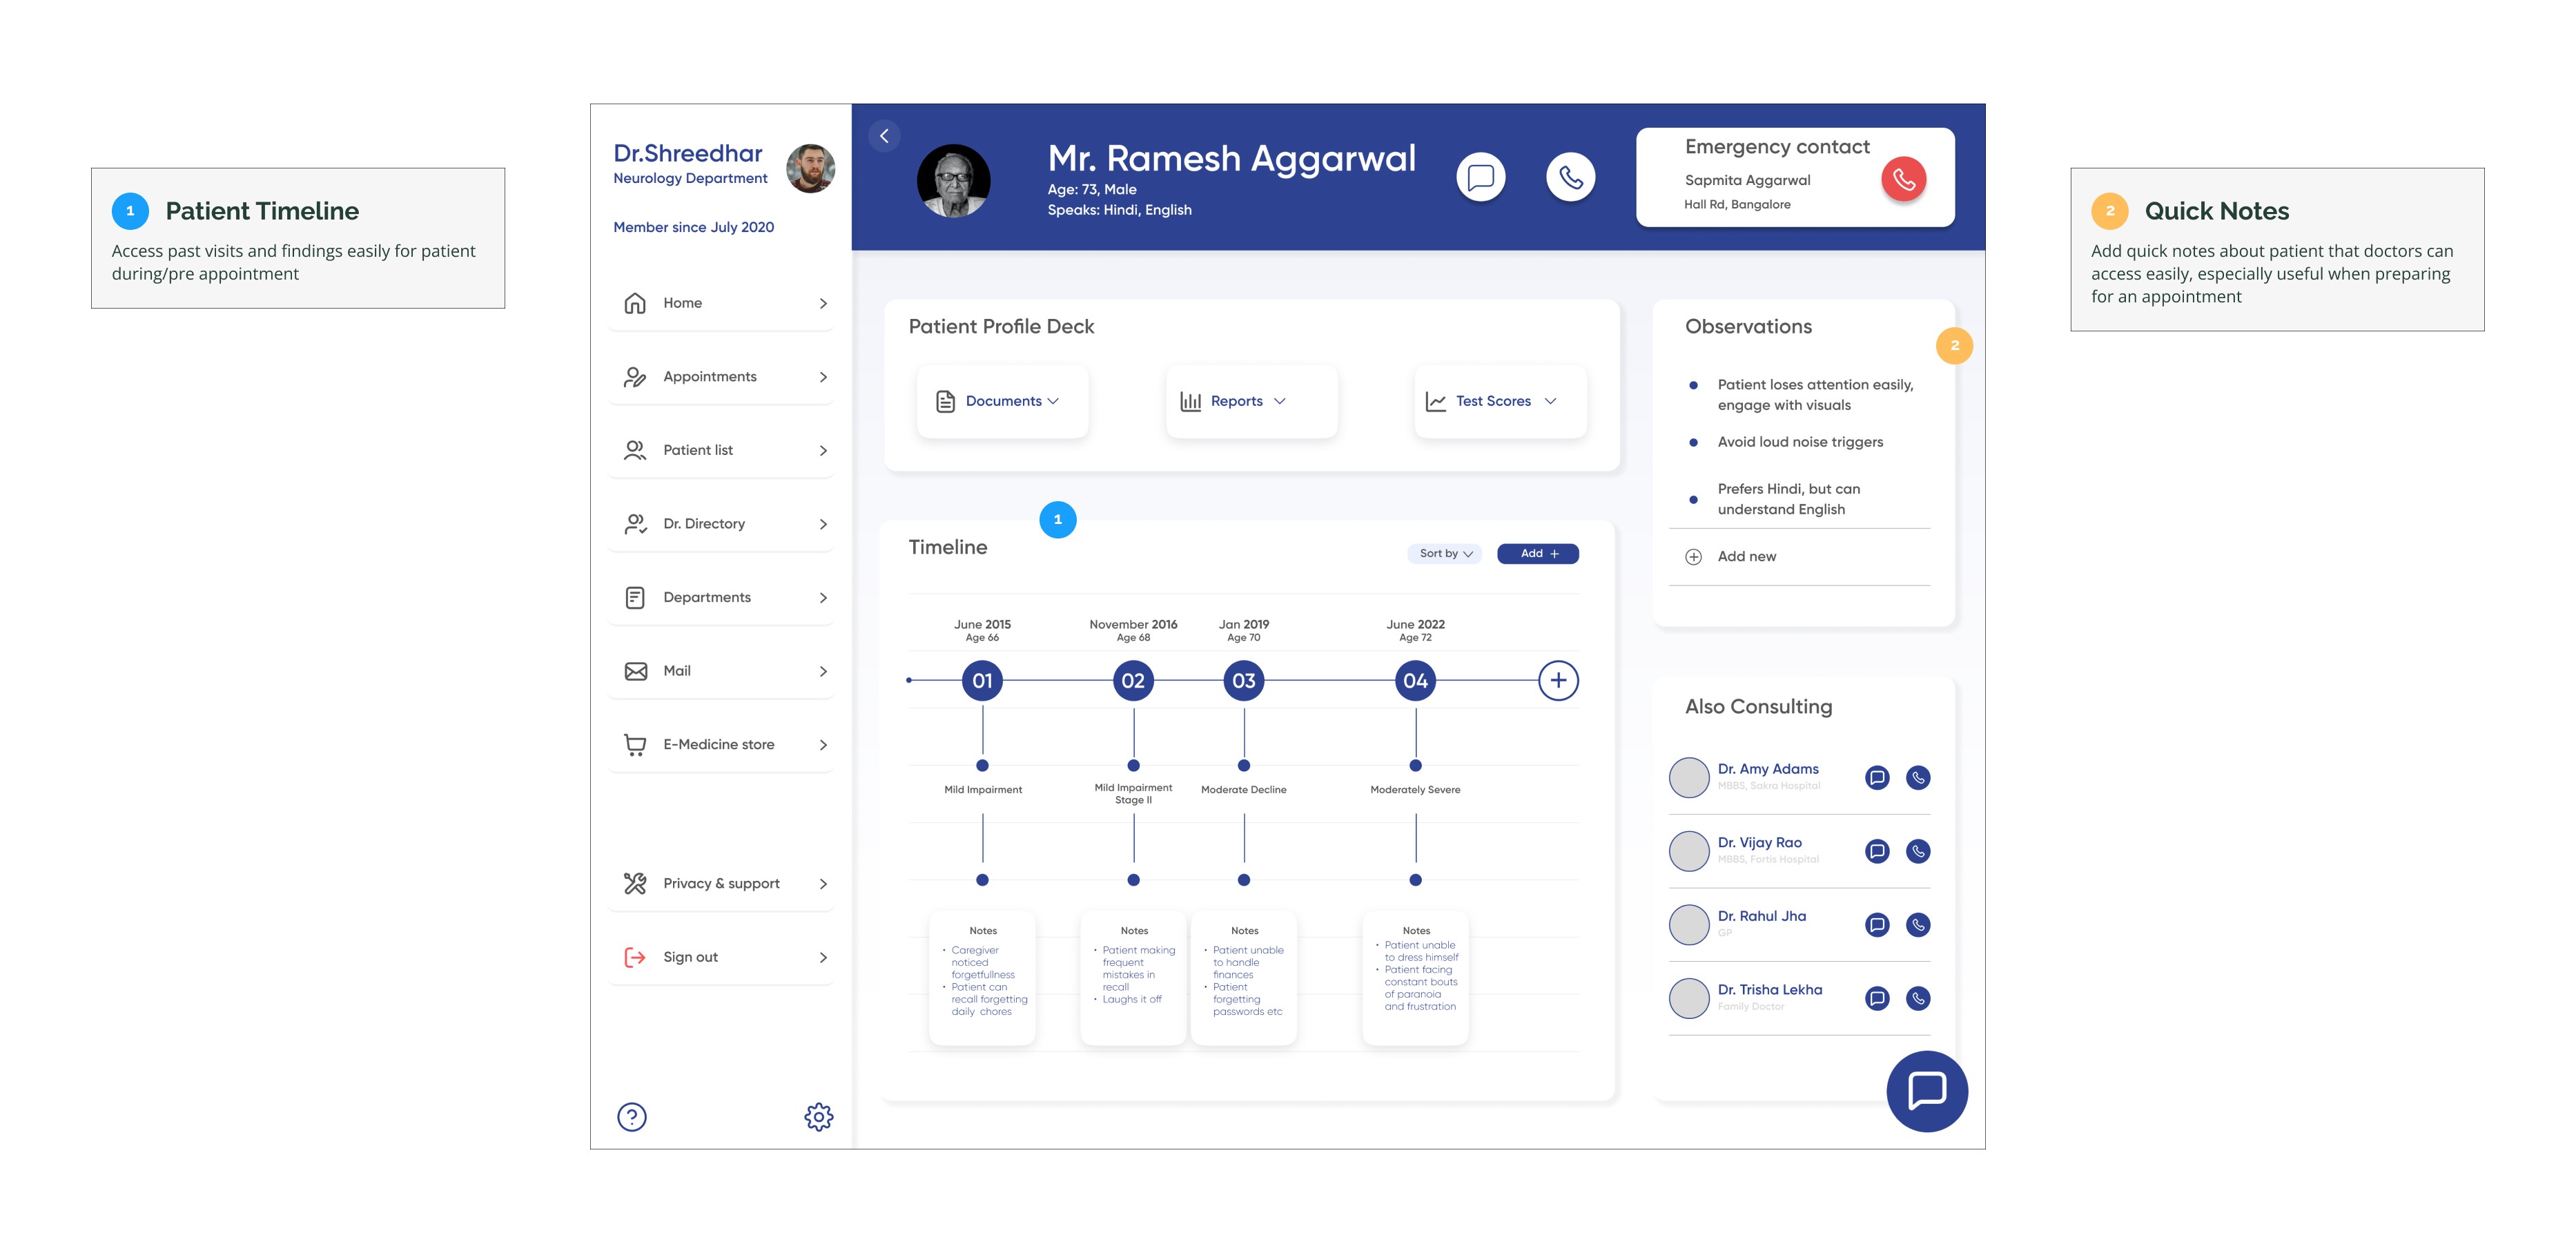
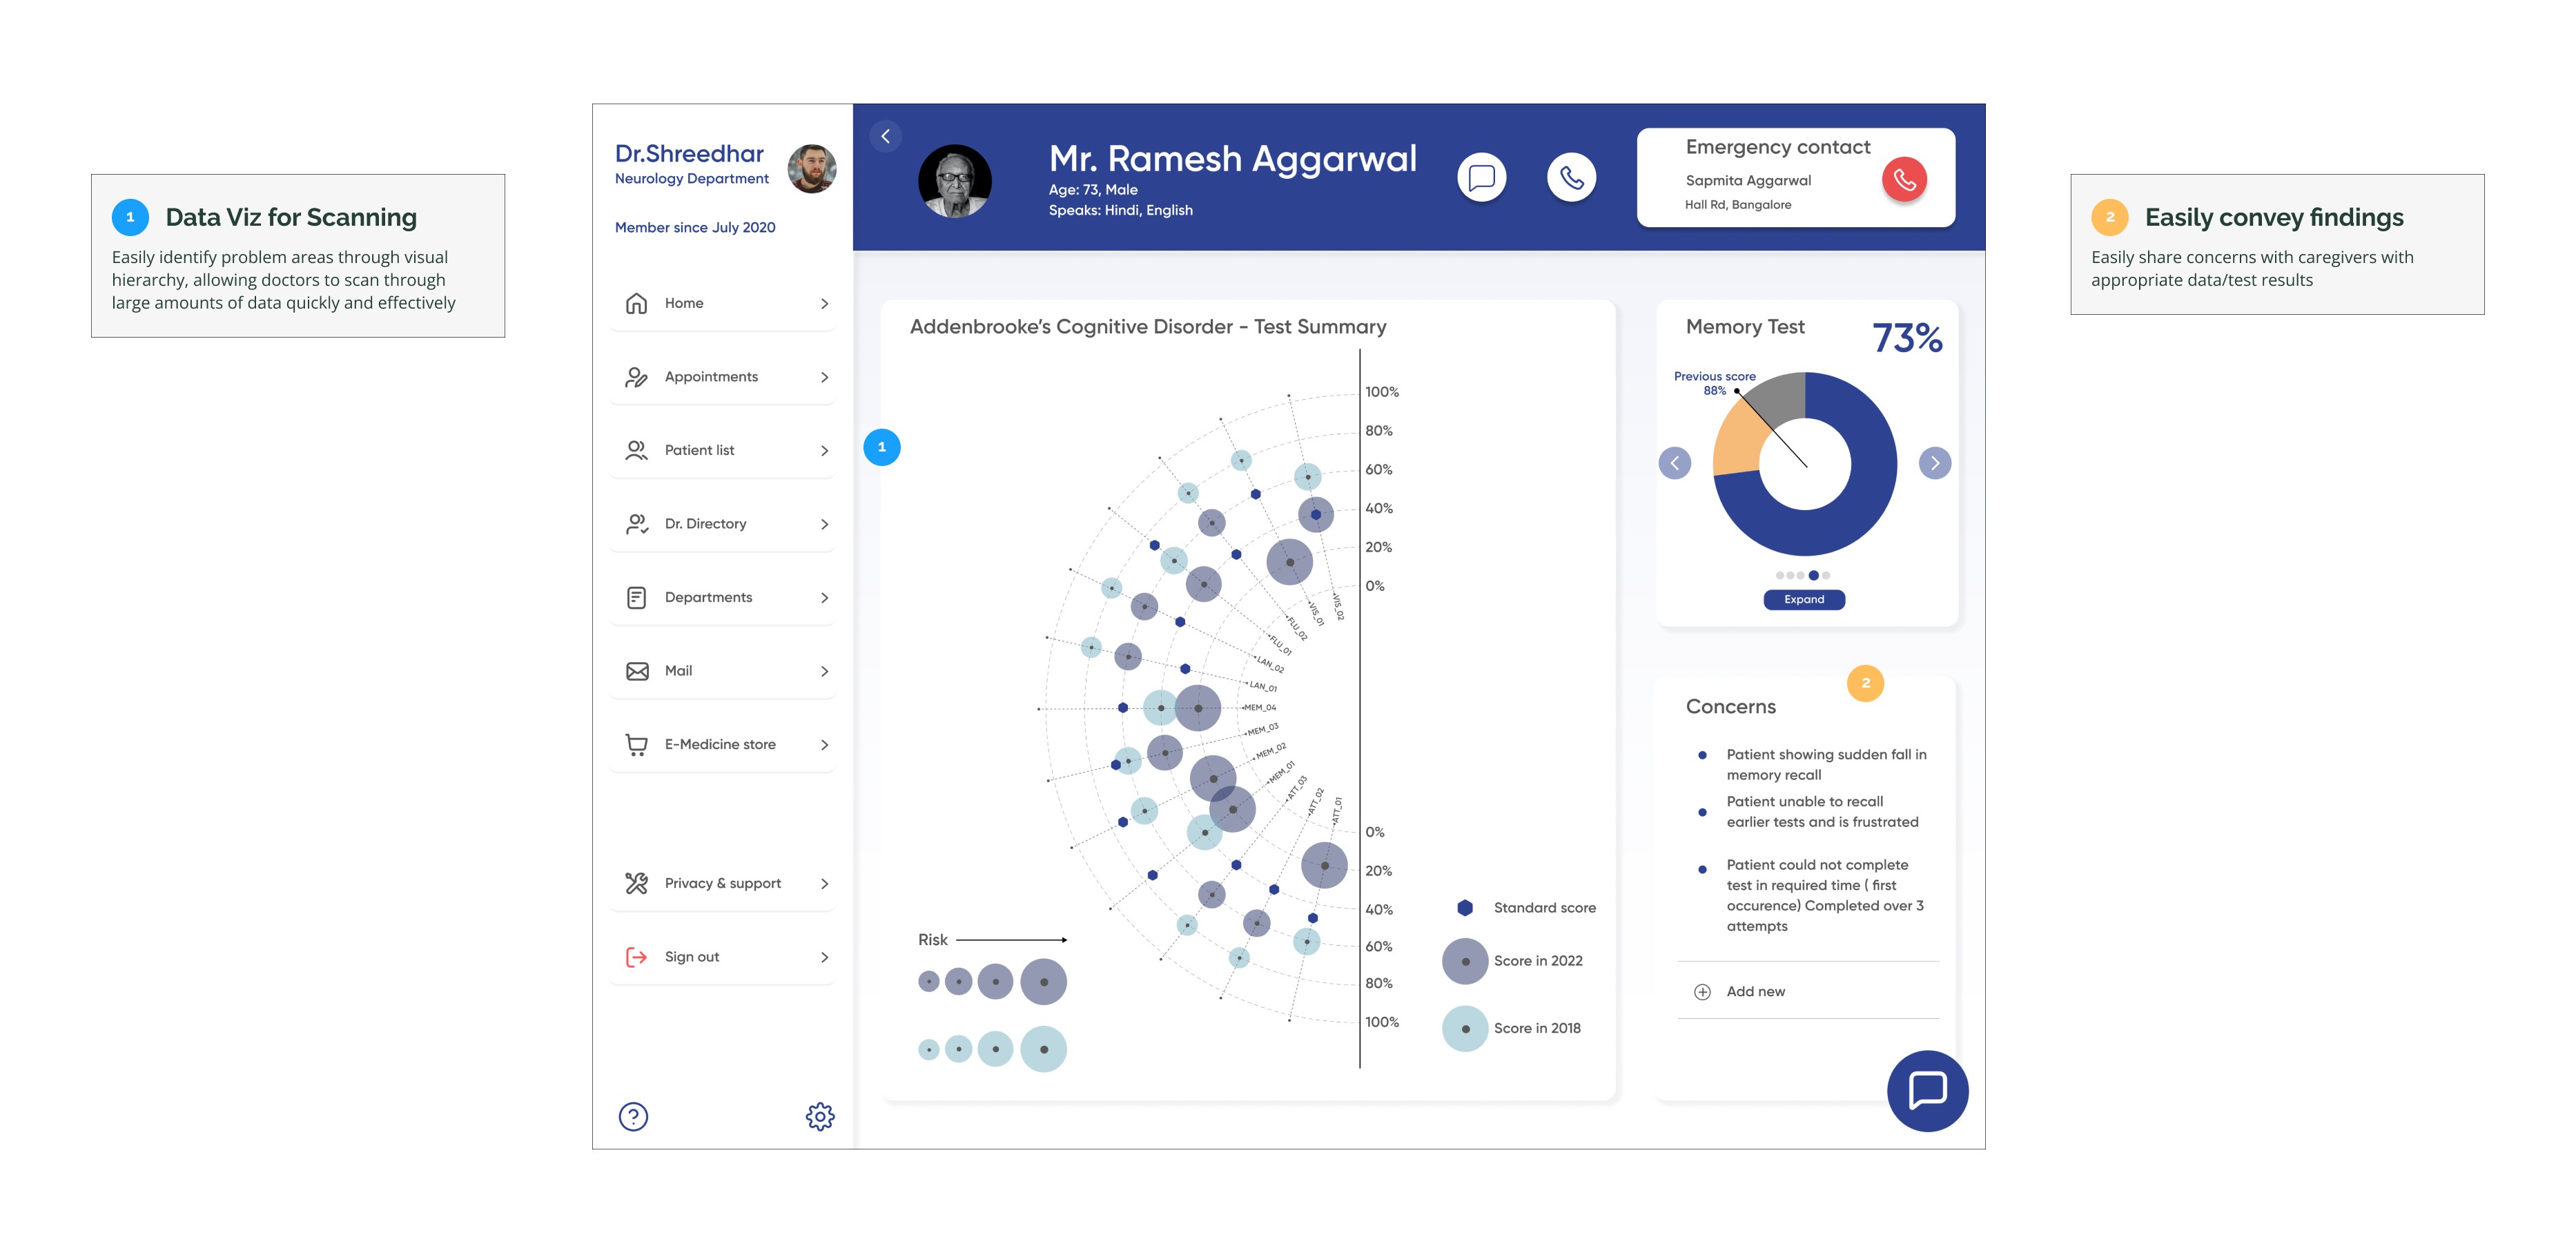
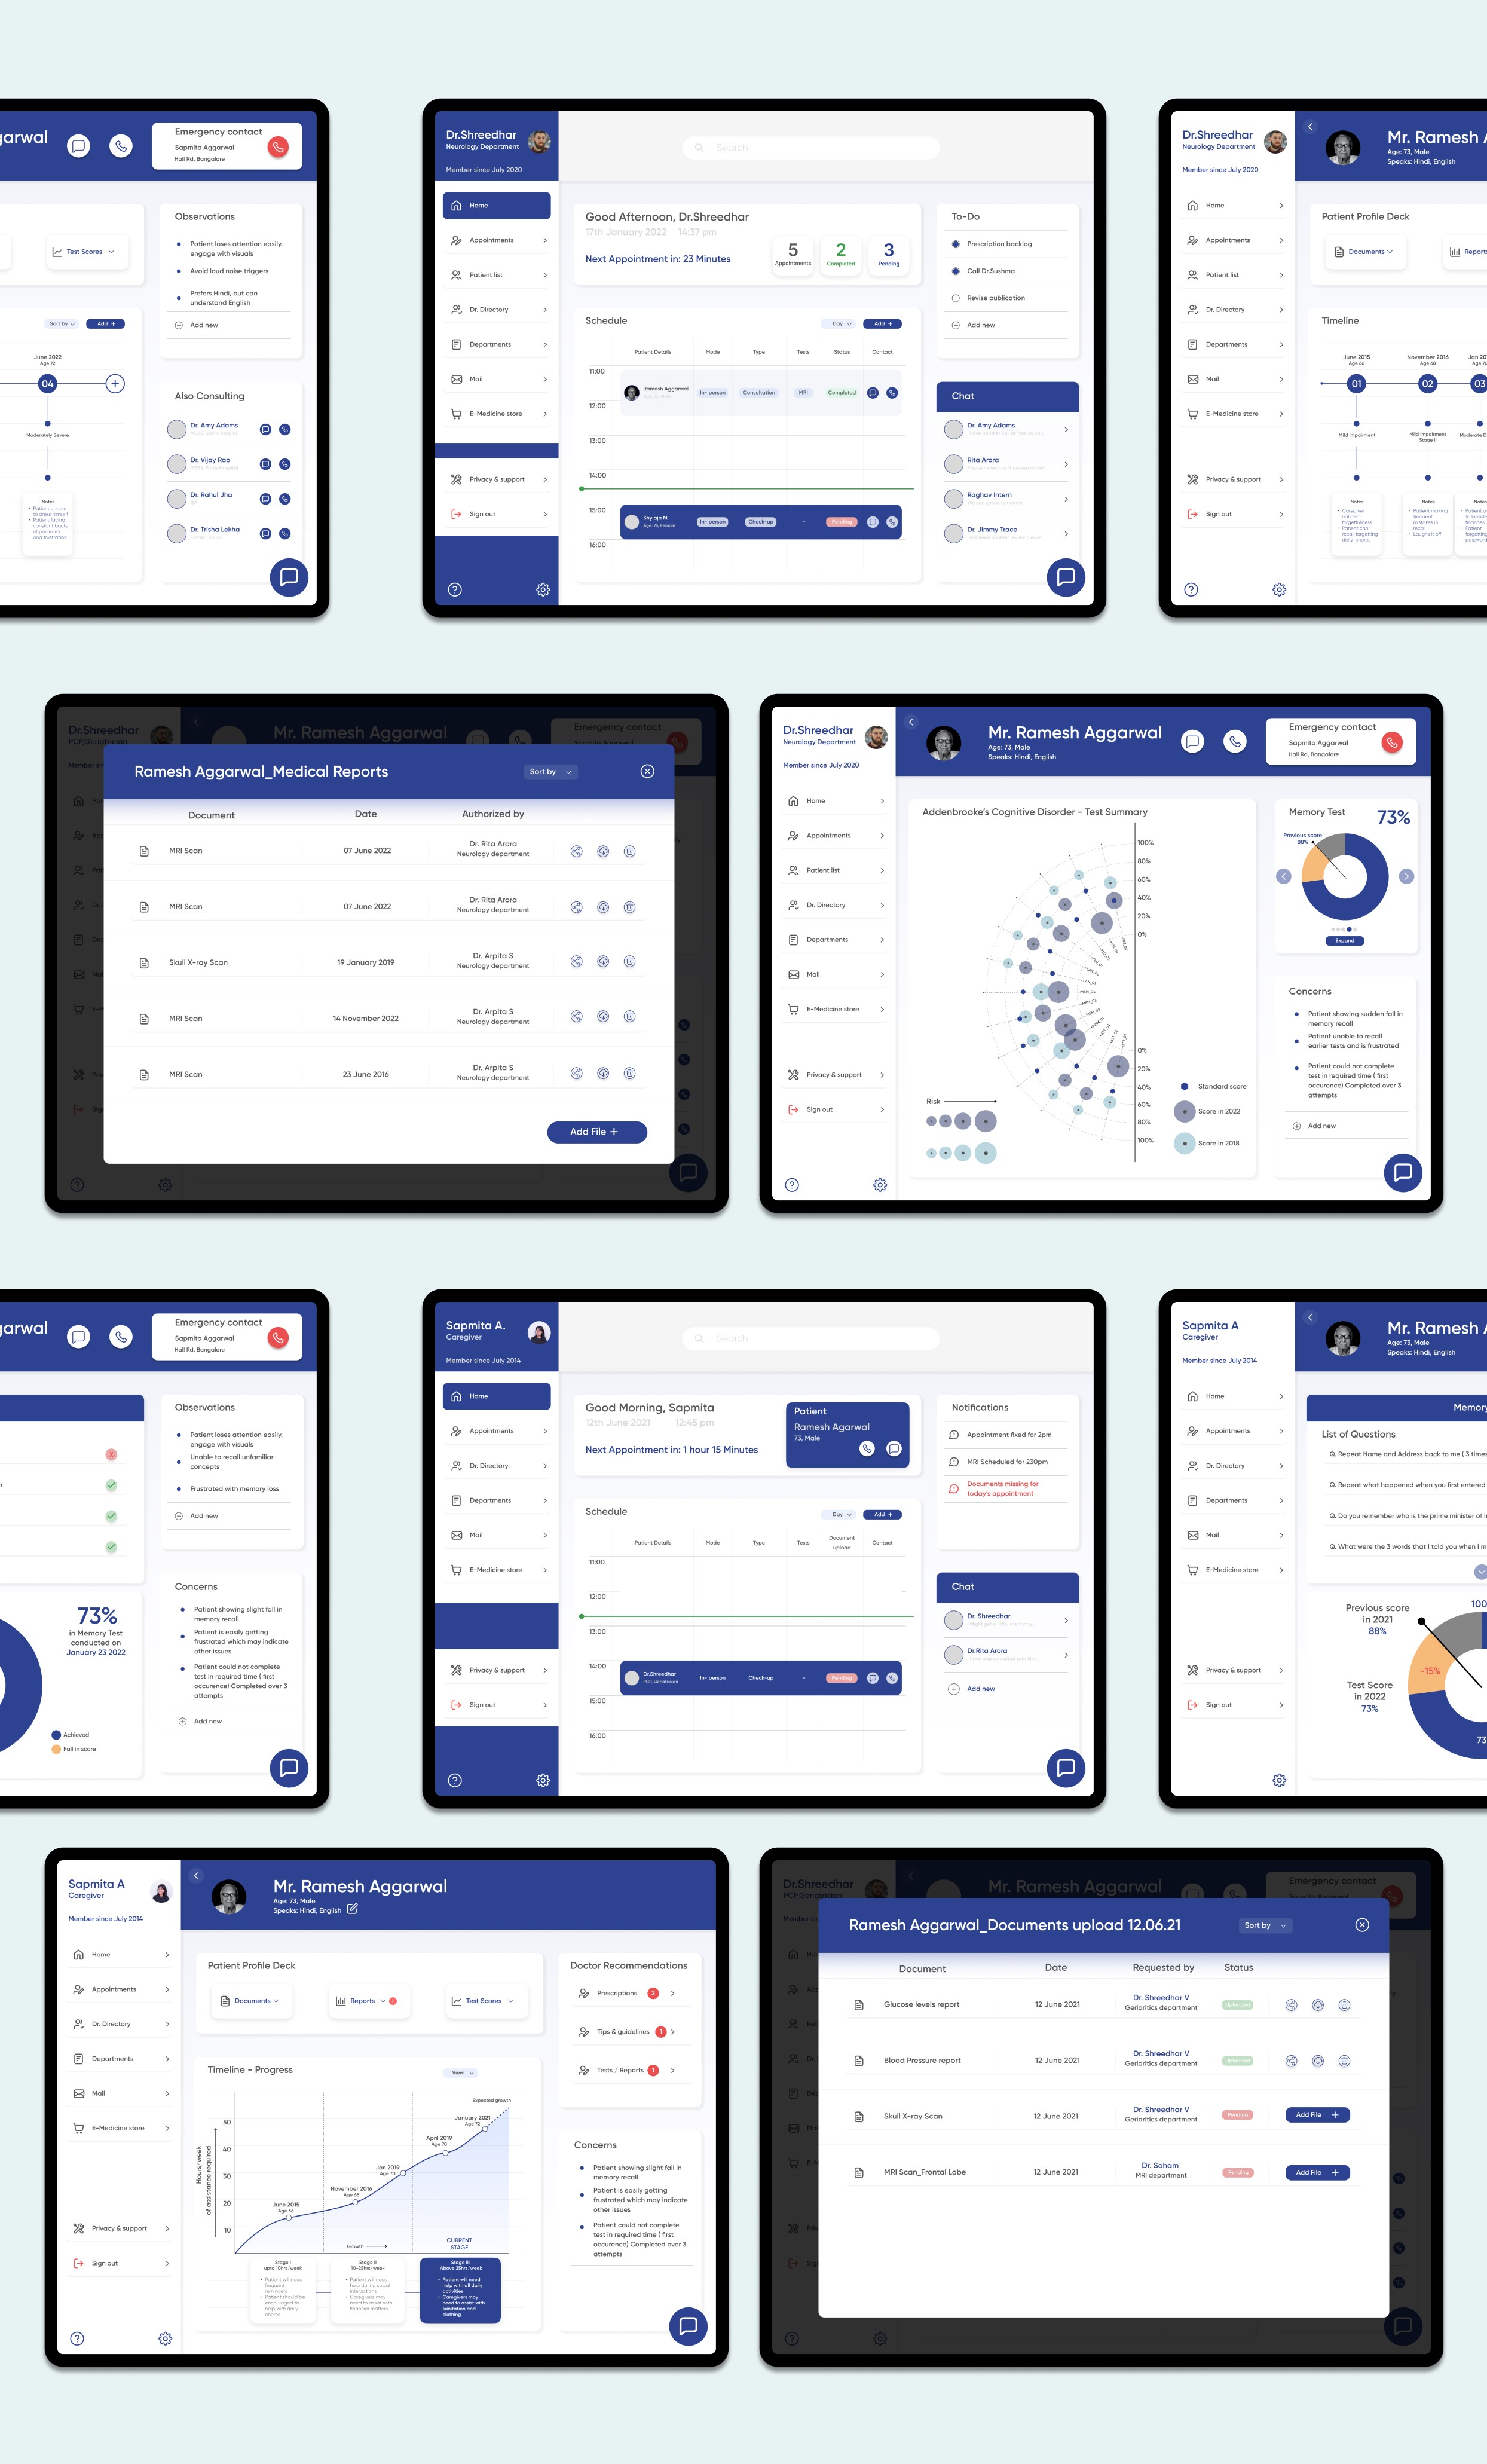
The main goal for the design screens for doctors was to present the information in a format that they could scan quickly and easily
The main goal for the design screens for doctors was to present the information in a format that they could scan quickly and easily
Some of the key design decisions included designing a clean & intuitive interface that allows for easy visual scanning. I prioritized the use of colors and sizes over text to enhance readability and quickly convey important info.
Some of the key design decisions included designing a clean & intuitive interface that allows for easy visual scanning. I prioritized the use of colors and sizes over text to enhance readability and quickly convey important info.
Some of the key design decisions included designing a clean & intuitive interface that allows for easy visual scanning. I prioritized the use of colors and sizes over text to enhance readability and quickly convey important info.
I integrated follow-up and patient notes features to help doctors remember past appointments and unique traits of each Alzheimer's patient, recognizing that all patients respond to the disease differently.
I integrated follow-up and patient notes features to help doctors remember past appointments and unique traits of each Alzheimer's patient, recognizing that all patients respond to the disease differently.
I integrated follow-up and patient notes features to help doctors remember past appointments and unique traits of each Alzheimer's patient, recognizing that all patients respond to the disease differently.




Design Screens for Caregivers
Design Screens for Caregivers
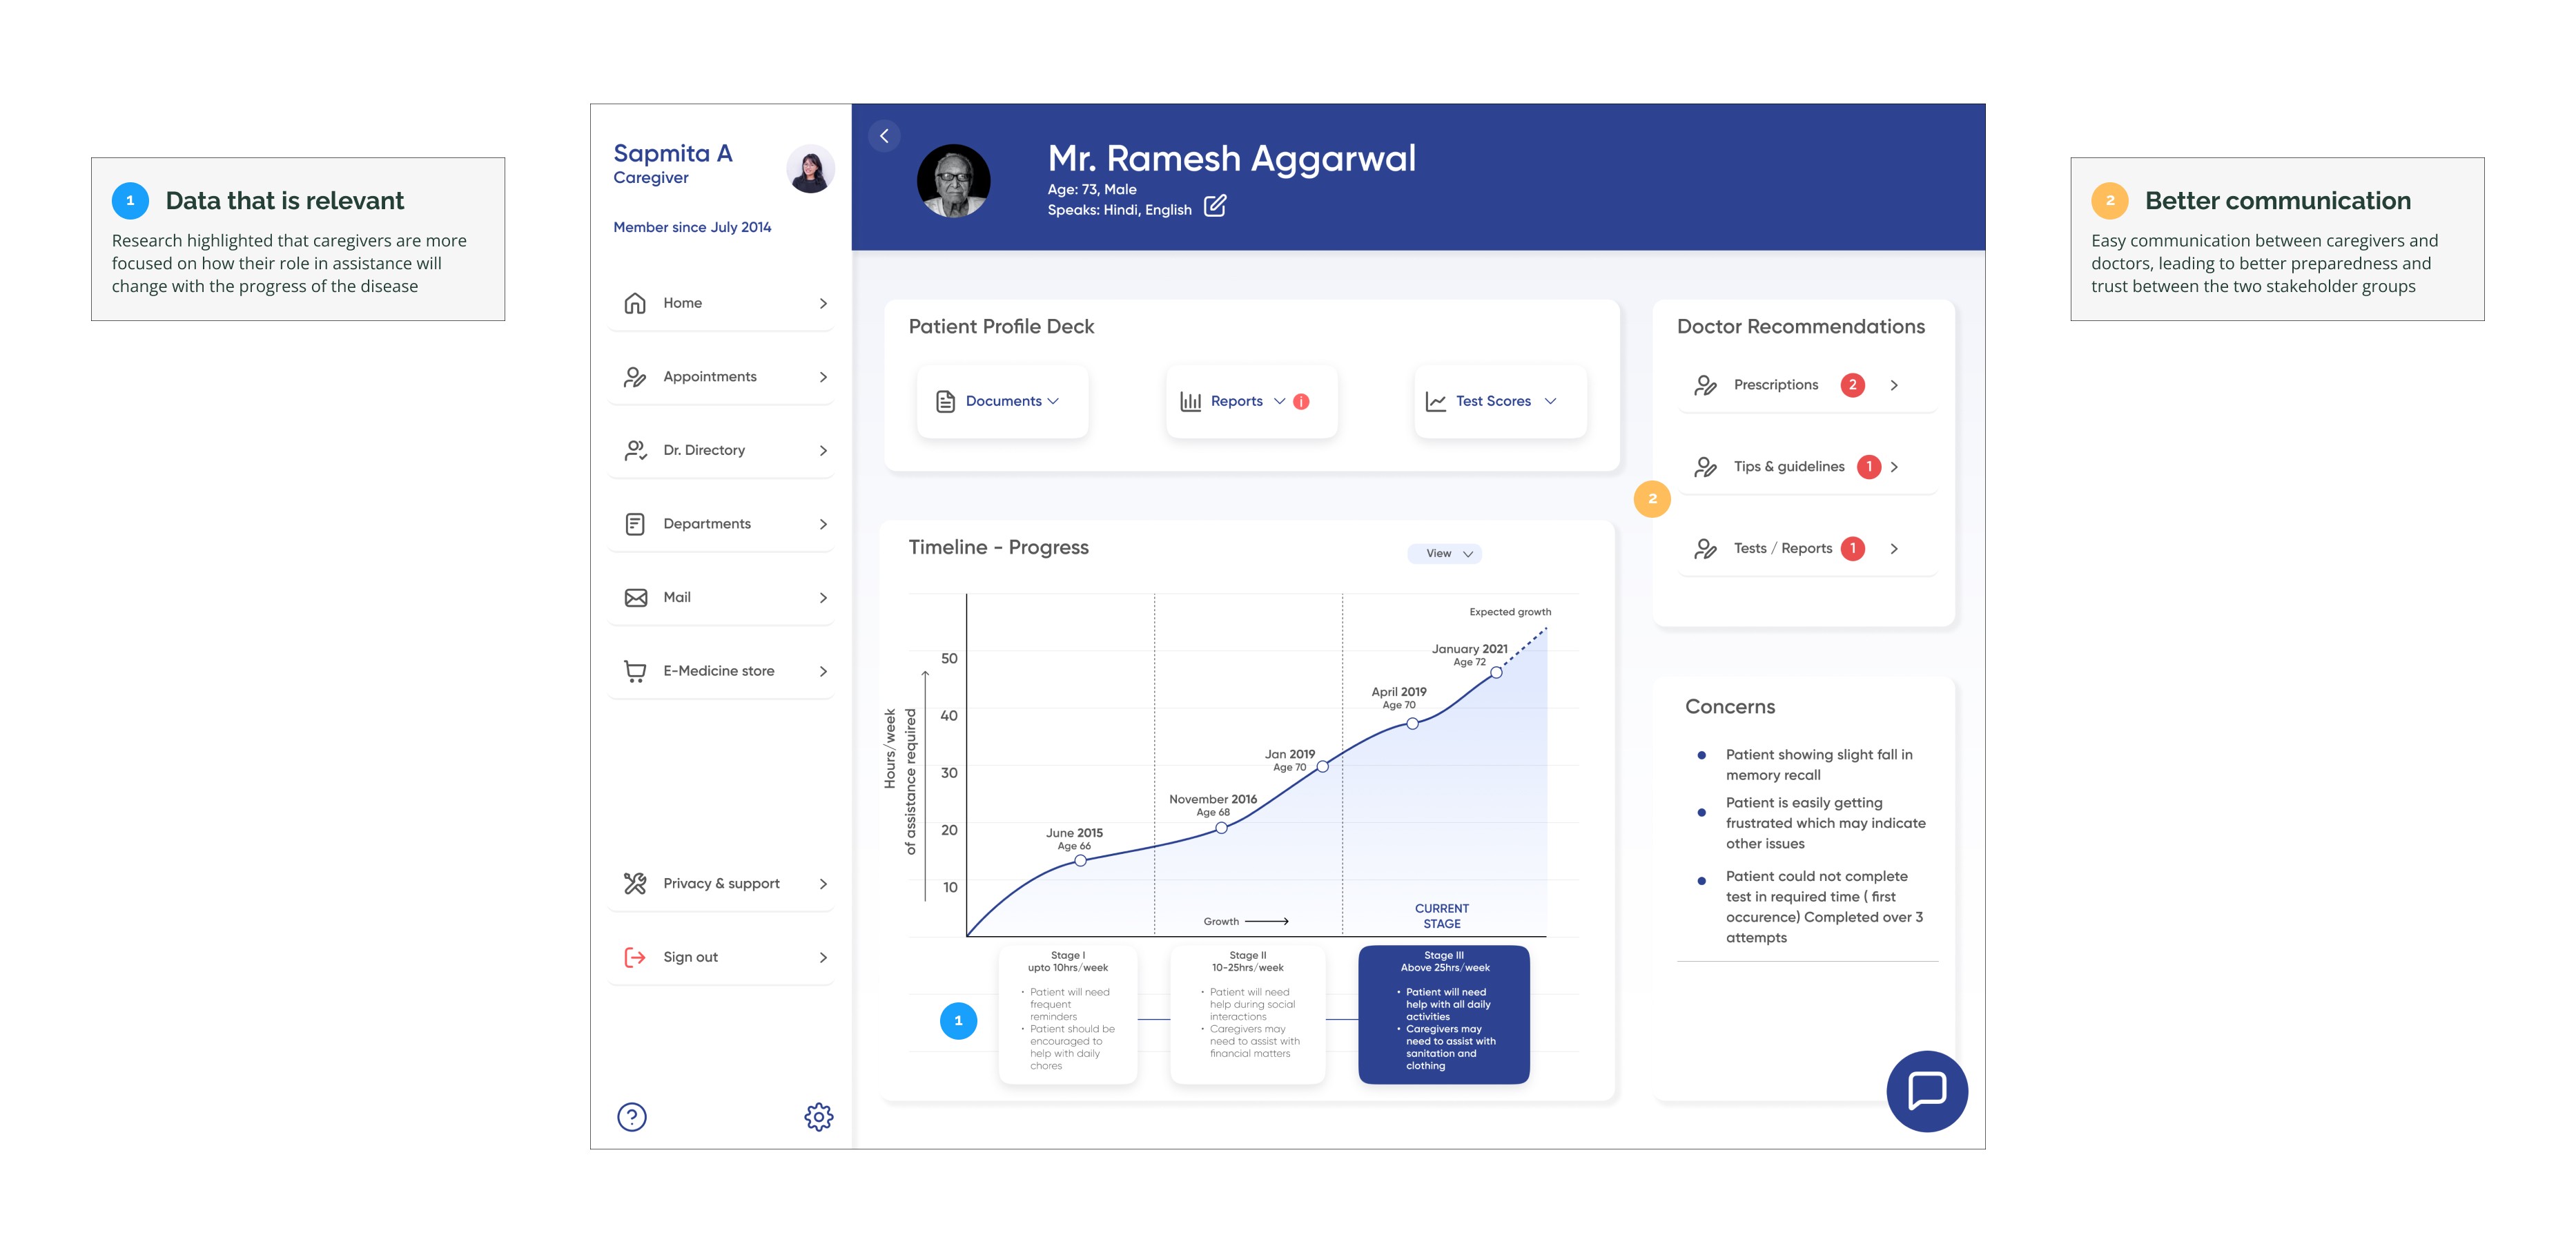
For caregivers, relevant information focused on changes in responsibilities over time rather than medical data that they might not understand.
For caregivers, relevant information focused on changes in responsibilities over time rather than medical data that they might not understand.
The fundamental break in communication is that the data is currently focused primarily on the disease rather than addressing the needs of the end users, namely the caregivers.
The fundamental break in communication is that the data is currently focused primarily on the disease rather than addressing the needs of the end users, namely the caregivers.
The fundamental break in communication is that the data is currently focused primarily on the disease rather than addressing the needs of the end users, namely the caregivers.
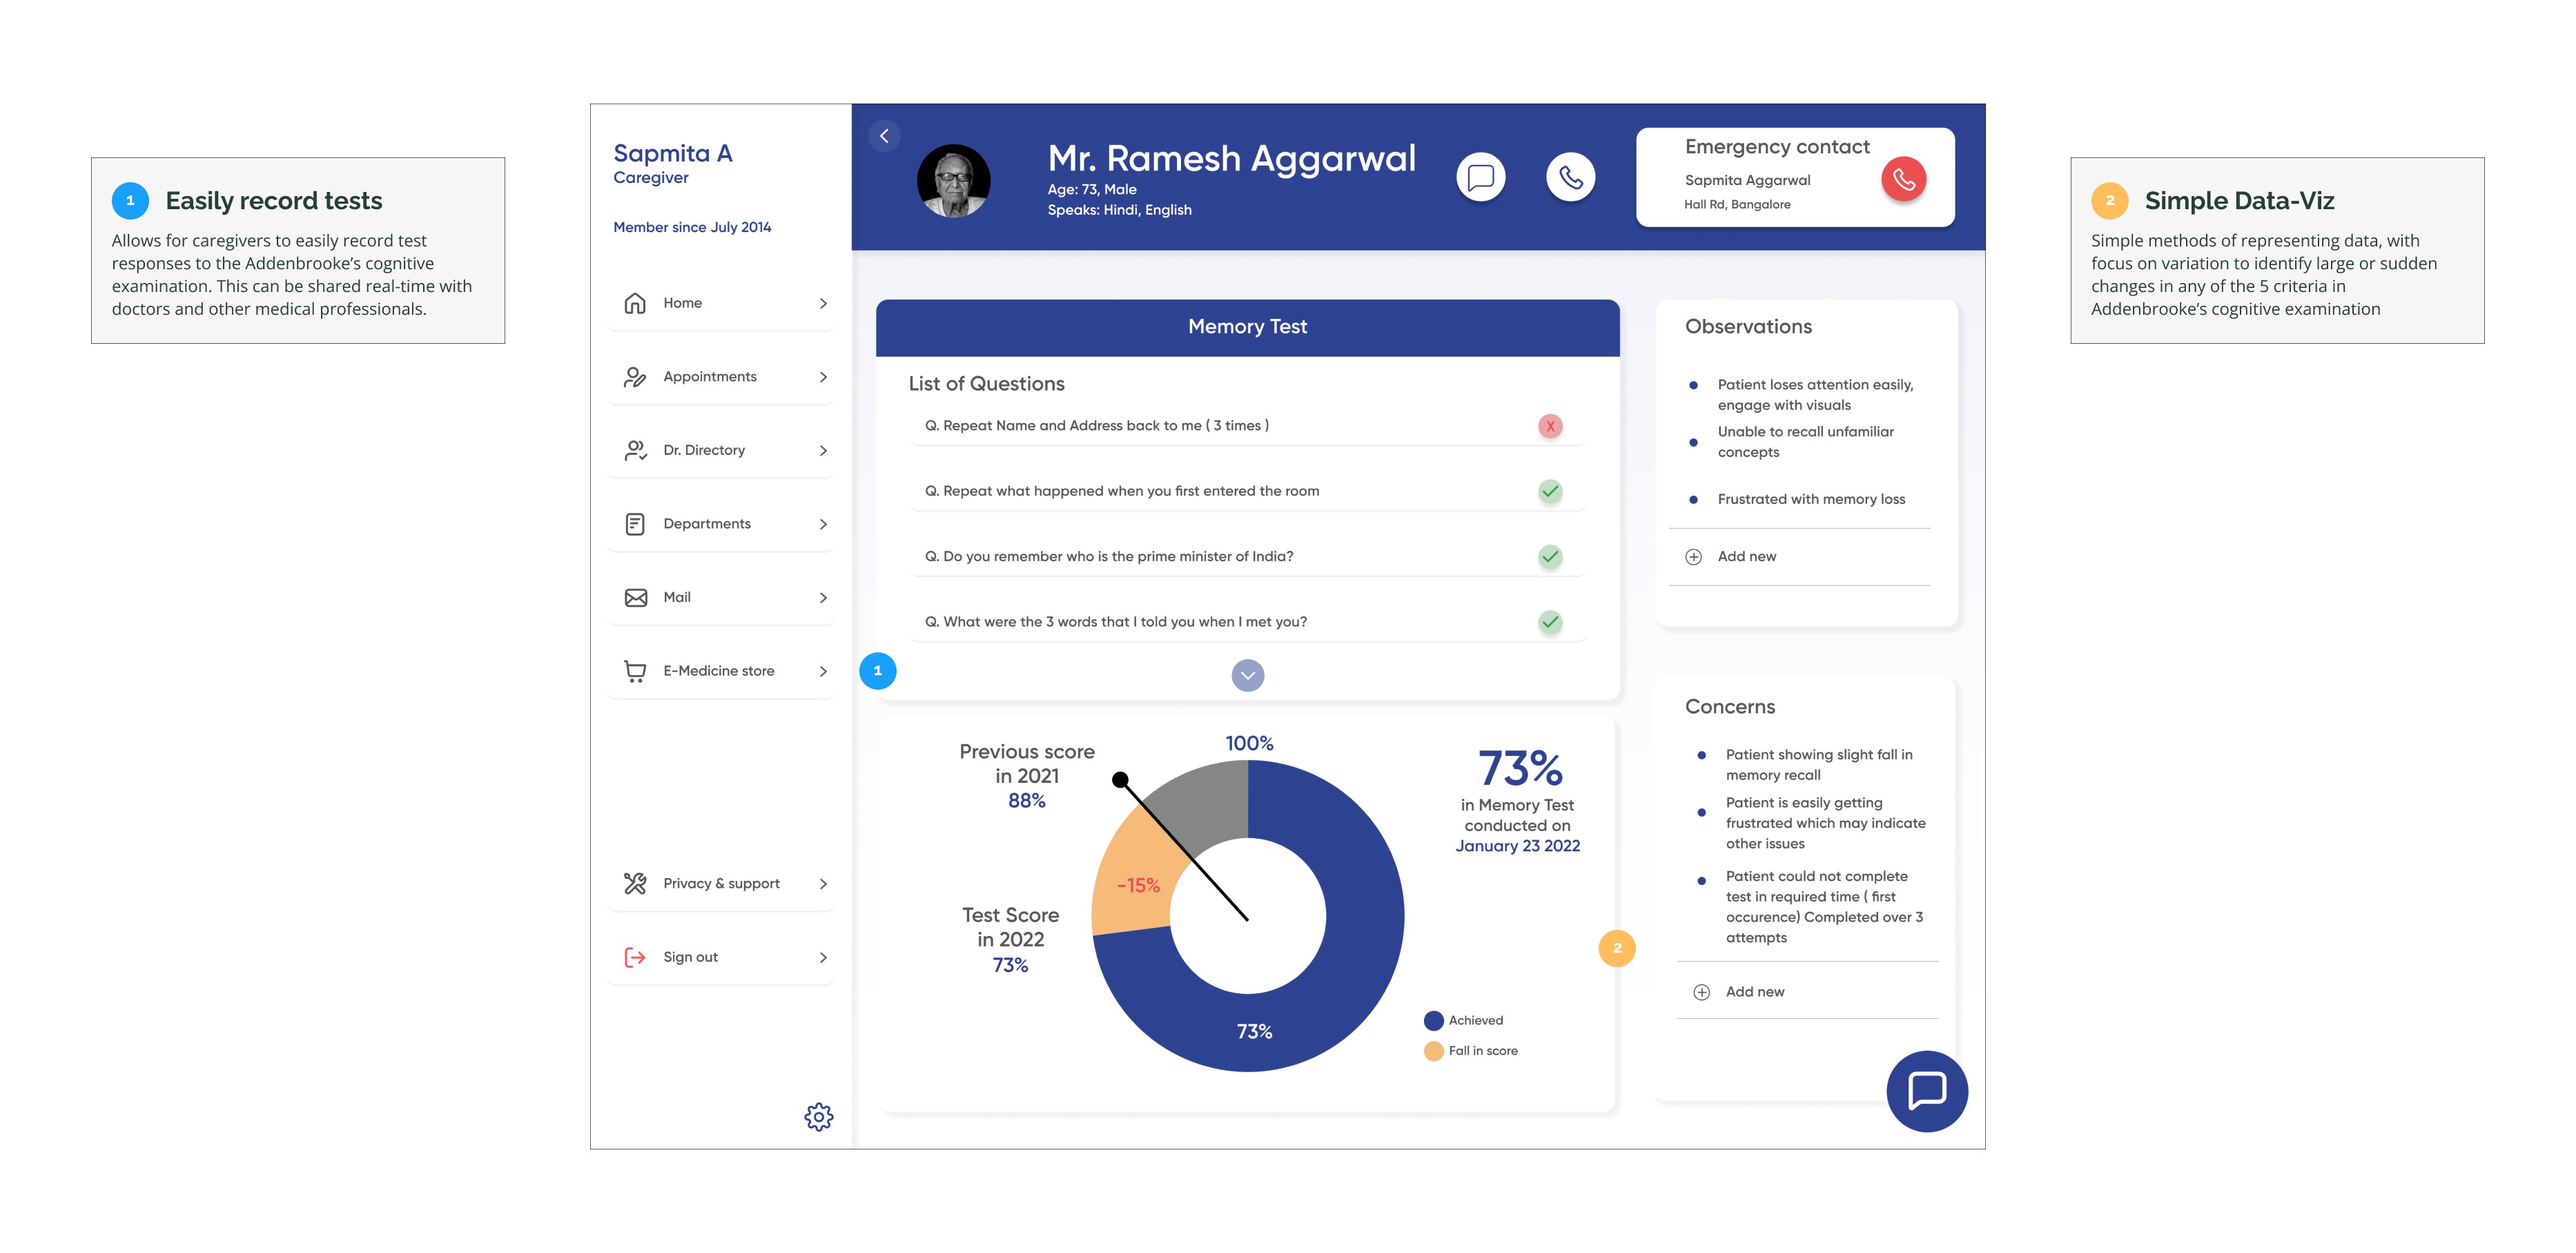
I focused on providing a quick and stress free way to record test results from the ACE allowing for fewer doctor visits, with only significant changes triggering notifications to doctors.
I focused on providing a quick and stress free way to record test results from the ACE allowing for fewer doctor visits, with only significant changes triggering notifications to doctors.
I focused on providing a quick and stress free way to record test results from the ACE allowing for fewer doctor visits, with only significant changes triggering notifications to doctors.




Shreedhar Verma Portfolio
sverma6@pratt.edu
©
Shreedhar Verma 2025
Shreedhar Verma Portfolio
sverma6@pratt.edu
©
Shreedhar Verma 2025
Conclusion
Conclusion
Being intimately involved in the caregiving process has not only deepened my empathy but has also sharpened my understanding of the intricate challenges involved in this field. Collaborating with Dr. Siddarth Ramanan added an academic dimension to my experience, allowing me to explore the delicate balance between caregivers and medical professionals in a research setting.
Being intimately involved in the caregiving process has not only deepened my empathy but has also sharpened my understanding of the intricate challenges involved in this field. Collaborating with Dr. Siddarth Ramanan added an academic dimension to my experience, allowing me to explore the delicate balance between caregivers and medical professionals in a research setting.
My biggest challenge
My biggest challenge
My biggest challenge
Conducting research with sensitivity and without a bias from my personal experiences
Conducting research with sensitivity and without a bias from my personal experiences
Conducting research with sensitivity and without a bias from my personal experiences
Next Steps
Next Steps
Next Steps
Use feedback from both user groups to improve the data visualization for better relevancy
Use feedback from both user groups to improve the data visualization for better relevancy
Use feedback from both user groups to improve the data visualization for better relevancy
My takeaway
My takeaway
My takeaway
interdisciplinary collaboration is essential for understanding and bridging information gaps.
interdisciplinary collaboration is essential for understanding and bridging information gaps.
interdisciplinary collaboration is essential for understanding and bridging information gaps.
More Projects —
Shreedhar Verma Portfolio
sverma6@pratt.edu
©
Shreedhar Verma 2025
Shreedhar Verma Portfolio
sverma6@pratt.edu
©
Shreedhar Verma 2025


